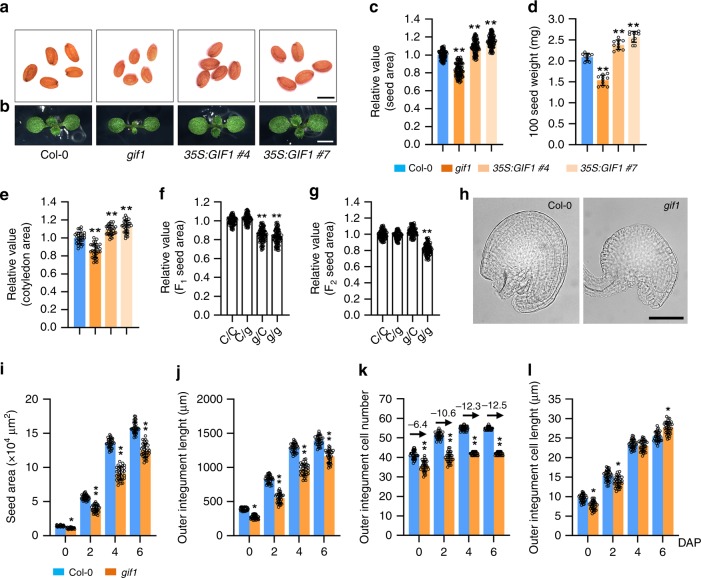
Fig. 5. GIF1 acts maternally to control seed development.
a, b The seeds (a) and 8-day-old seedlings (b) of Col-0, gif1, 35S:GIF1 #4, and 35 S:GIF1 #7. c–e The relative seed area (c, n = 100), 100 seed weight (d, n = 10), and cotyledon area (e, n = 30) of Col-0, gif1, 35S:GIF1 #4, and 35S:GIF1 #7. Seeds from the third to seventh silique on the stem of six plants were used for analysis. Cotyledons from the 8-day-old seedlings were used for analysis. f, g The relative area of F1 seeds (f) and F2 seeds (g) from Col-0/Col-0 (C/C), Col-0/gif1 (C/g), gif1/Col-0 (g/C), and gif1/gif1(g/g) plants (n = 100). h The Mature ovule of Col-0 and gif1 plants at 0 DAP (days after pollination). i–l The seed area (i), outer integument length (j), outer integument cell number (k), and outer integument cell length (l) of Col-0 and gif1 plants at 0, 2, 4, and 6 DAP (n = 33). Ovules and seeds from six siliques, which were from the fourth silique on the stem of six plants, were used for analysis. Scale bars, 0.5 mm (a), 0.2 cm (b), and 50 μm (h). Error bars represent ±SE. Different lowercase letters above the columns indicate the significant difference among different groups, one-way ANOVA P-values: P < 0.05. Asterisk indicates significant difference from the Col-0, one-way ANOVA P-values: *P < 0.05 and **P < 0.01.

