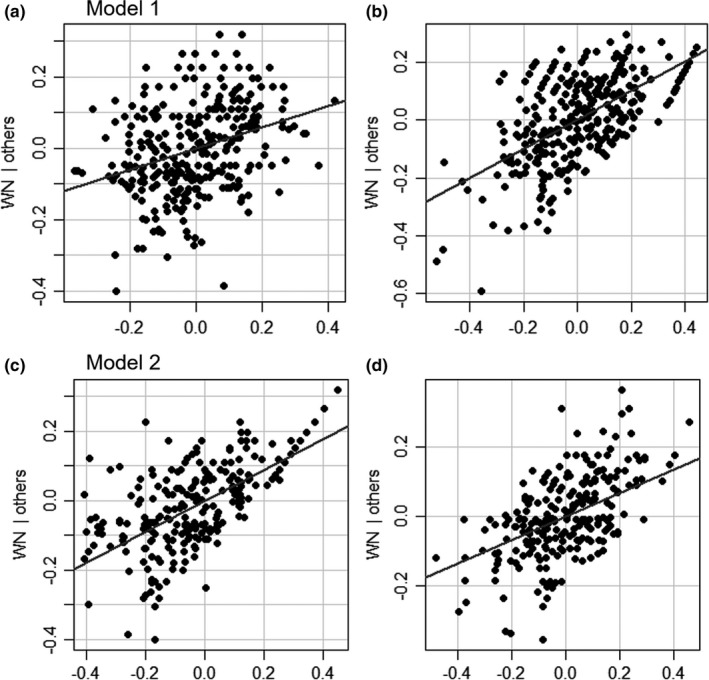
FIGURE 3.

Relationship between all‐host β‐diversity (βH), parasitized host β‐diversity (βPH), parasitoid β‐diversity (βP) (explanatory variables), and interaction β‐diversity (βWN) (predicted variable). Model 1 (a, b) includes all hosts (βH). Model 2 (c, d) includes only parasitized hosts (βH). Partial regression plots obtained from linear models when the effect of the other explanatory variable is removed
