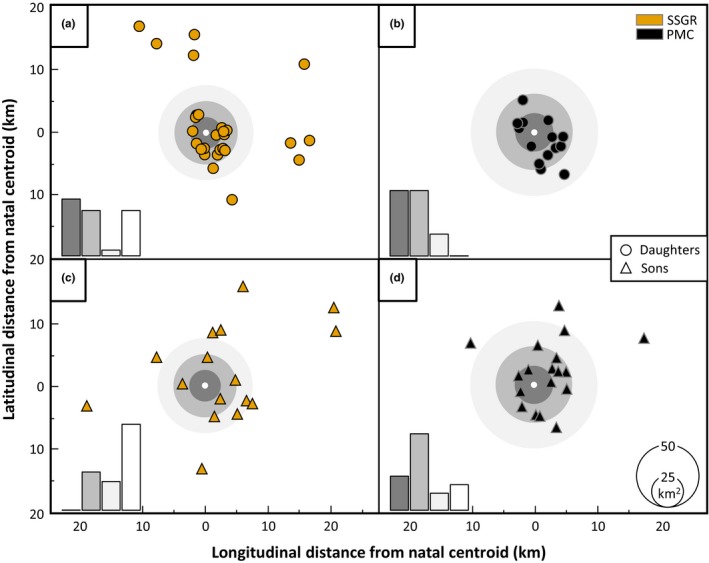
Figure 3.

Spatial distribution of postdispersal offspring relative to their natal home‐range. Postdispersal centroids for daughters (circles) and sons (triangles) are shown relative to their superimposed maternal centroids (white circles) for SSGR (gold) and PMC (black). Rings of gray indicate the area of successional average female home‐range (95% ADKE) radii around the natal centroid; three levels are shown: the maternal home‐range (dark gray), the 1st‐order peripheral home‐range (gray), and the 2nd‐order peripheral home‐range. A linear summary of the proportion of individuals in each category is provided (bar graph bottom left)
