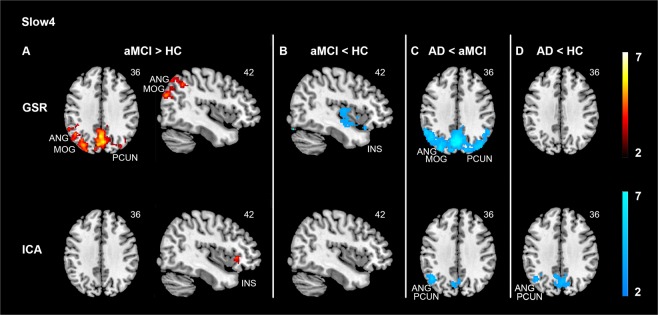
Figure 2.
Divergent slow4 hemodynamic variability changes in the default mode and the salience networks in aMCI and AD. Compared with HC, GSR approach revealed higher variability in the default mode network (A, top panel) while lower variability in the salience network (B, top panel) in aMCI. However, after ICA-based denoising, there was higher variability in the salience network in aMCI than in HC (A, bottom panel). Moreover, AD showed lower variability in the default mode network (PCUN, ANG) compared with HC after ICA-based denoising (D, bottom panel), which was absent for the GSR approach (D, top panel). Across both data denoising methods, AD showed lower variability in the default mode network compared with aMCI (C). Results were obtained at p < 0.05 family wise error (FWE) correction on the cluster level, with a previous height threshold of p < 0.001, superimposing on the MNI brain template. Same slices were displayed to ease comparison between GSR approach and ICA-based denoising. Colour bar represents T value. Abbreviations: AD = Alzheimer’s disease; aMCI = Amnestic mild cognitive impairment; ANG = Angular gyrus; GSR = Global signal regression; HC = Healthy controls; ICA = Independent component analysis; INS = Insula; MOG = Middle occipital gyrus; PCUN = Precuneus.

