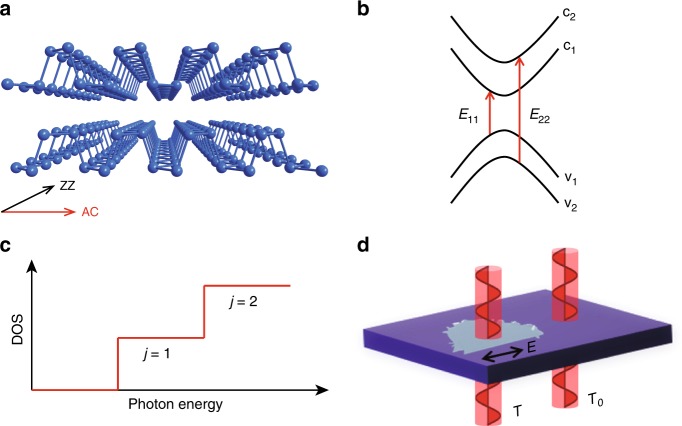
Fig. 1. Crystal structure and IR characterization of few-layer BP.
a Puckered structure of 2 L BP, with two characteristic crystal orientations: AC and ZZ. b Schematic illustration of optical transitions between quantized subbands, with the symbols E11 and E22 denoting transitions v1 → c1 and v2 → c2, respectively. c Illustration of joint DOS in 2D systems, showing step-like features. d FTIR measurement configuration with T and T0 denoting the light transmittance of the substrate with and without BP samples, respectively. The arrow indicates the polarization of the incident IR beam, along the AC direction of the BP sample.

