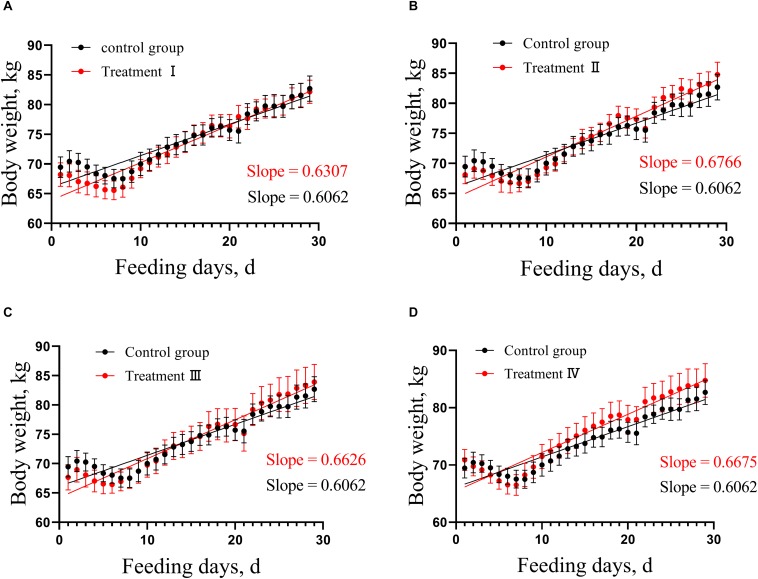
FIGURE 1.
Comparison of linear growth rate between each of treatment groups and control. (A) Treatment I and control, (B) Treatment II and control. (C) Treatment III and control. (D) Treatment IV and control. According to the weight change of pigs in the treatment groups and the control, the linear regression was calculated, then the difference between the pair-wise linear regression was compared, respectively. Slope means linear growth rate.

