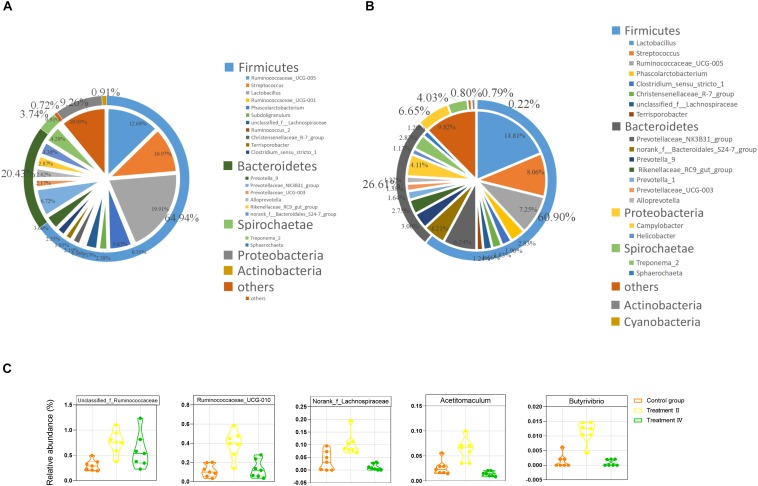
FIGURE 4.
The gut microbiota composition of Suhuai pigs at phyla and genera level. (A) Relative distribution of the 20 most dominant bacterial genera and the phyla to which they belong in caecal samples. (B) Relative distribution of the 20 most dominant bacterial genera and the phyla to which they belong in colonic samples. Different shades of color represent different taxa. The pie chart depicts different genera. The outer ring around the pie chart depicts different phyla. Numbers in brackets denote the range of relative abundance of the bacteria. (C) Relative abundance of five fiber-degrading bacteria were significantly higher in treatment II compared to those in the control group (P < 0.01).

