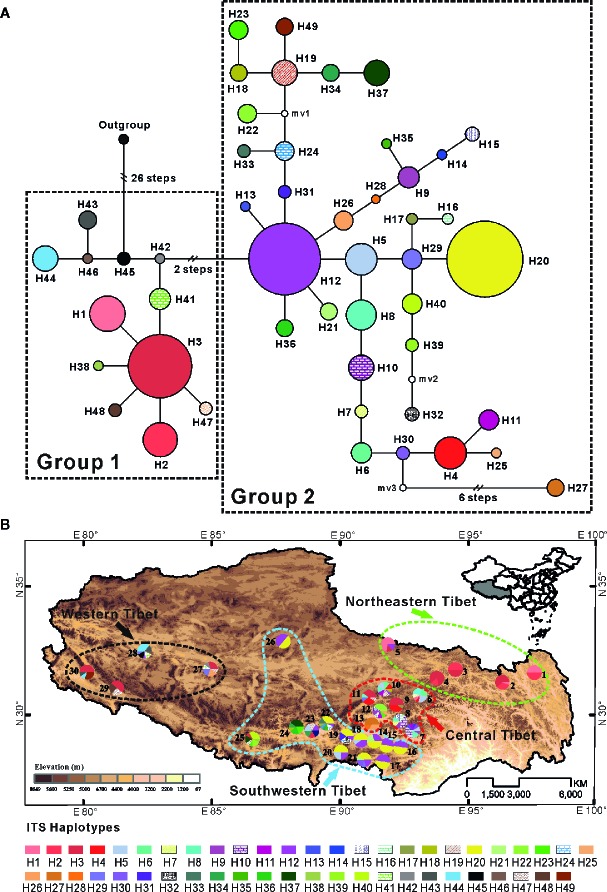
Figure 2.
(A) Network of 49 ITS haplotypes for C. hendersonii. Each circle means a single haplotype sized in proportion to its frequency. Different colors denote different haplotypes. (B) Geographic distribution of all 49 ITS haplotypes detected in C. hendersonii (see Table 1 for population codes).

