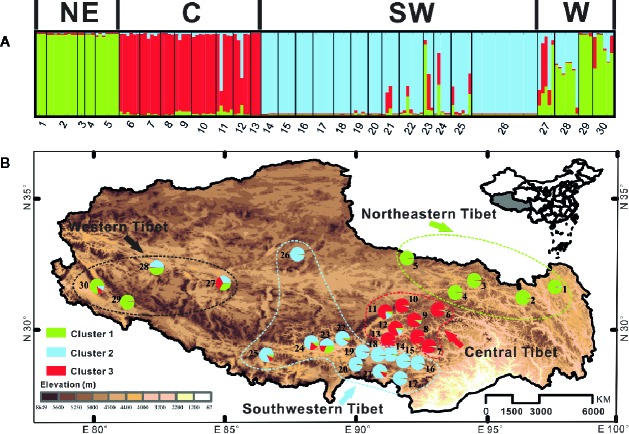
Figure 3.
Bayesian clustering results of the structure analysis for ITS sequence data of 368 individuals (30 populations) of C. hendersonii form the Tibetan Plateau. (A) Histogram of the structure analysis for the model with K = 3; (B) Geographic origin of the 30 C. hendersonii populations and their color-coded grouping according to the structure analysis for the model with K = 3. NE, northeastern Tibet; C, central Tibet; SW, southwestern Tibet; W, western Tibet.

