Figure 1.
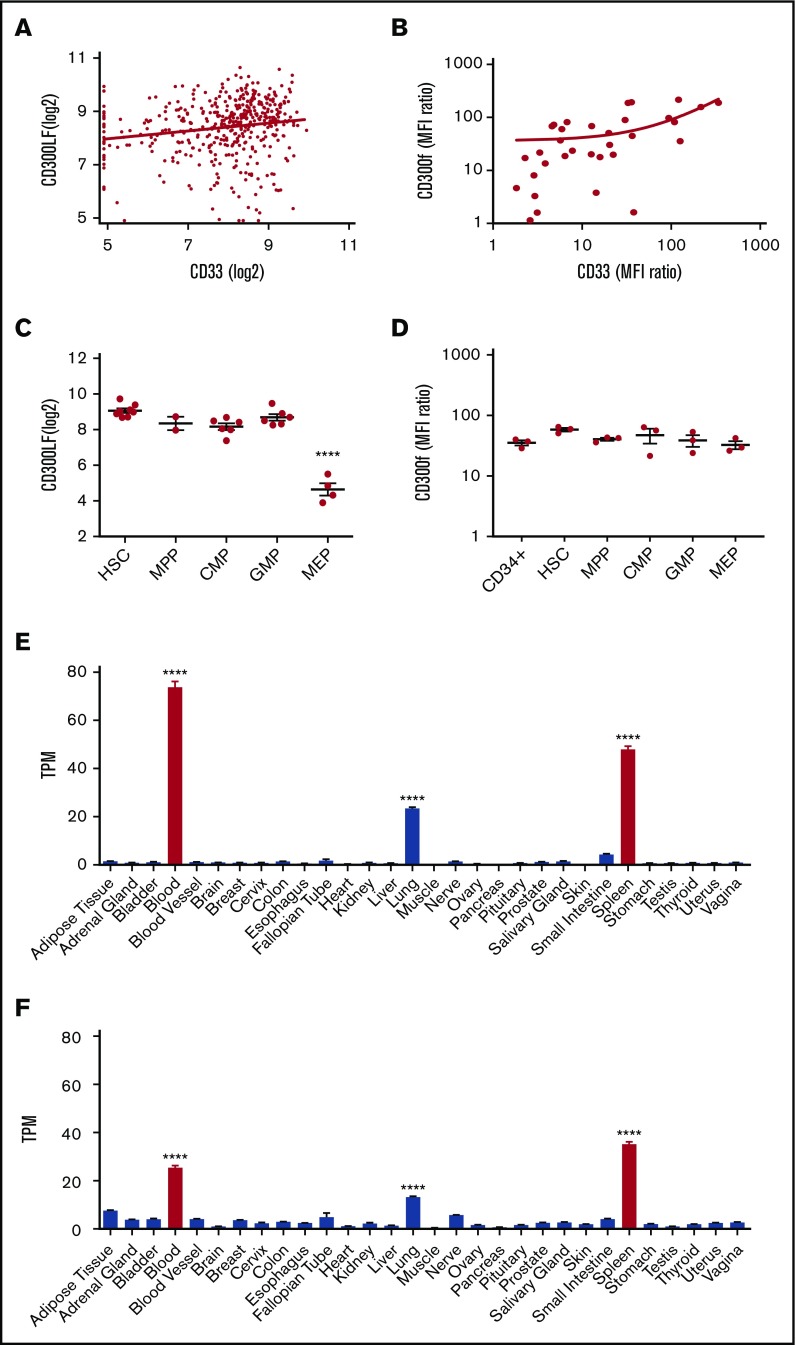
CD300f expression on AML cells, HSPCs, and organ expression. (A) CD33 is compared with CD300f by gene expression using linear regression analysis. (B) MFI ratios of CD33 and CD300f on patient-derived AML cells (n = 33) are compared with linear regression. (C) CD300f gene expression across HSPC subtypes (****P < .0001 megakaryocyte/erythroid progenitors vs all other subtypes). (D) MFI ratios of CD300f on HSPC from healthy BM. (E) CD300f gene expression by RNA-seq across multiple organ types from the human GTEx dataset (****P < .0001 blood, spleen or lung vs all organs). (F) CD33 gene expression by RNA-seq across multiple organ types (****P < .0001 blood, spleen, or lung vs all organs). Red bars indicate hematopoietic organs. TPM, transcripts per million.

