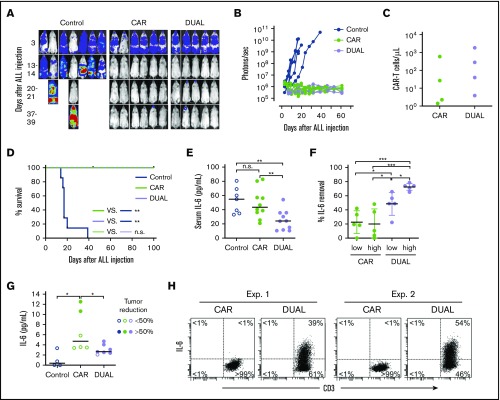
Figure 7.
CAR–T cells expressing mbaIL6 quench IL-6 and exert antileukemia activity in xenograft models. (A) NOD/scid-IL2RGnull mice were injected IV with 0.5 to 1 × 10⁶ Nalm-6-luciferase cells. On day 3, mice were given T cells expressing either anti-CD19 CAR alone (85% CAR expression) or mbaIL6 plus CAR (“DUAL”; 79% CAR expression) (20 × 106/mouse IV); all mice received 20 000 IU IL-2 IP every 2 days. Ventral images from the Xenogen IVIS-200 system after D-luciferin injection are shown (captured with enhanced sensitivity on day 3 to visualize Nalm-6 engraftment; full set of ventral and dorsal images is shown in supplemental Figure 7). (B) Luminescence measurements (photons per second) in the mice. Each point corresponds to a measurement in 1 mouse. (C) Levels of GFP+ CD3+ CAR–T cells in blood 50 days after CAR–T cell injection in a subset of the mice. (D) Kaplan-Meier curves of overall survival for the mice shown in panel A, euthanized when the total bioluminescence signal reached 1 × 10¹⁰ photons/second. **P < .01 by log-rank test. (E) T cells expressing either anti–CD19 CAR or anti–CD19 CAR plus mbaIL6 were injected IV in NOD/scid-IL2RGnull mice (2-10 × 106/mouse); 3 days later, 50 ng of human IL-6 was injected IP. After 2 hours, mice were euthanized, and serum was collected by cardiac puncture to measure levels of human IL-6 by using ELISA. Each symbol corresponds to data from 1 mouse; bars show mean (±SD). **P < .01. (F) Mice from the experiments shown in panel E were divided according to the number of T cells that were administered: 2 to 4 × 10⁶ (“low”) and 5 to 10 × 106 (“high”). Values correspond to the percentage of IL-6 that was removed from serum in each mouse, using as a reference the mean value of IL-6 measured in mice that received IL-6 with no prior injection of T cells. *P = .035 for CAR low vs DUAL low, P = .045 from CAR high vs, DUAL low, P = .013 for DUAL low vs DUAL high; ***P < .001. (G) Daudi-luciferase cells were injected IP in NOD/scid-IL2RGnull mice (20 × 106/mouse), followed 3 days later by THP-1 and/or T cells IP (20 × 106 for both cell types). Tumor engraftment was measured by in vivo imaging (supplemental Figure 8). Mice were euthanized 48 hours after THP-1 and/or T-cell injection. Symbols show IL-6 levels measured by using ELISA in peritoneal lavage, according to percentage of tumor reduction. *P = .032 for CAR vs no T cells; P = .046 for CAR vs DUAL. (H) IL-6 binding to T cells from the peritoneal lavage of 4 mice, 2 injected with CAR–T cells and 2 injected with T cells expressing both CAR and mbaIL6. Cells were stained with anti-mouse CD45-PE-Cy7, anti-human CD45-PerCP, anti-human CD3-APC, and anti-human IL-6-PE; the plots show selectively gated mouse CD45–, human CD45+, and human CD3+ cells.

