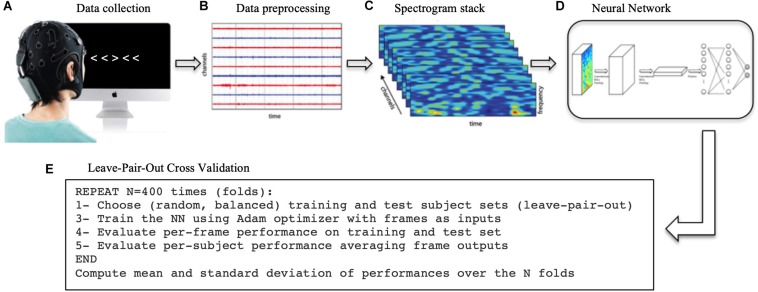
FIGURE 1.
Methodological process. (A) First, the EEG data was collected while the subjects performed the Flanker task. (B) The data was then processed, filtered and cut into in epochs of 1 s time-locked at each trial to extract ERPs. (C) The Wavelet transform was applied to each single trial to extract the spectrograms. (D) The spectrogram stacks were input into the CNN (and RNN/SNN for comparison). (E) The network was trained 400 times (folds) using a different training/test sets each time. The network final performance is the average of the 400-folds performances.

