
Figure 2.
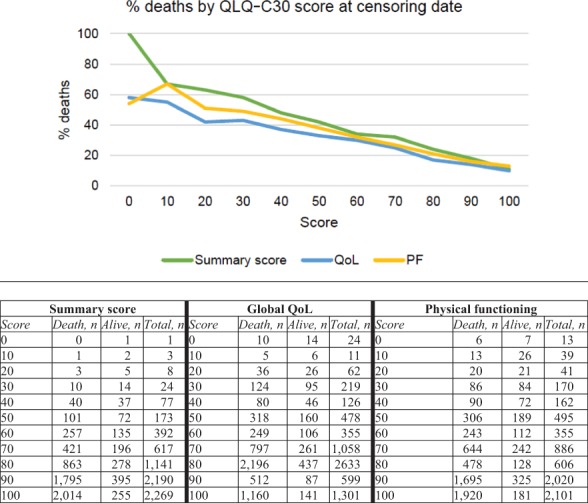
Proportions of deaths at censuring date by the score distribution of summary score, global quality of life (QoL), and physical functioning (PF) scale.
Official websites use .gov
A
.gov website belongs to an official
government organization in the United States.
Secure .gov websites use HTTPS
A lock (
) or https:// means you've safely
connected to the .gov website. Share sensitive
information only on official, secure websites.
Proportions of deaths at censuring date by the score distribution of summary score, global quality of life (QoL), and physical functioning (PF) scale.