
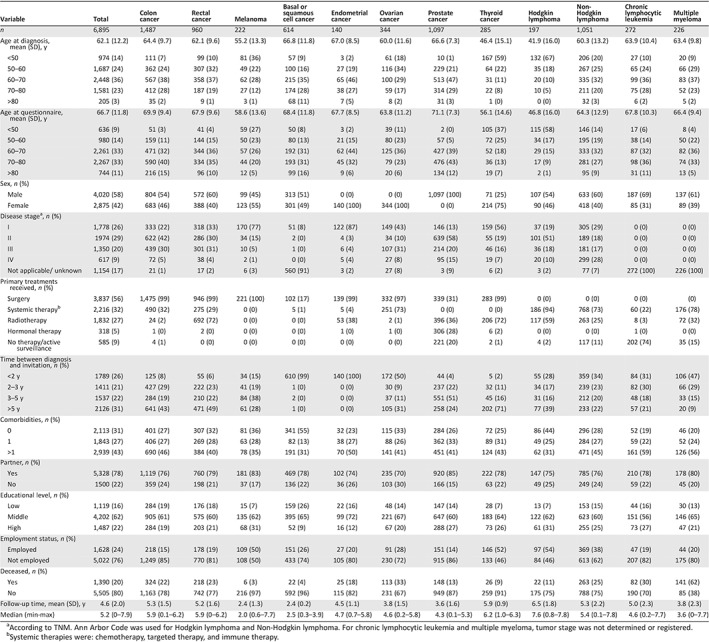
Table 1.
Sociodemographic and clinical characteristics of study participants
| Variable | Total | Colon cancer | Rectal cancer | Melanoma | Basal or squamous cell cancer | Endometrial cancer | Ovarian cancer | Prostate cancer | Thyroid cancer | Hodgkin lymphoma | Non‐Hodgkin lymphoma | Chronic lymphocytic leukemia | Multiple myeloma |
|---|---|---|---|---|---|---|---|---|---|---|---|---|---|
| n | 6,895 | 1,487 | 960 | 222 | 614 | 140 | 344 | 1,097 | 285 | 197 | 1,051 | 272 | 226 |
| Age at diagnosis, mean (SD), y | 62.1 (12.2) | 64.4 (9.7) | 62.1 (9.6) | 55.2 (13.3) | 66.8 (11.8) | 67.0 (8.5) | 60.0 (11.6) | 66.6 (7.3) | 46.4 (15.1) | 41.9 (16.0) | 60.3 (13.2) | 63.9 (10.4) | 63.4 (9.8) |
| <50 | 974 (14) | 111 (7) | 99 (10) | 81 (36) | 57 (9) | 3 (2) | 61 (18) | 10 (1) | 167 (59) | 132 (67) | 206 (20) | 27 (10) | 20 (9) |
| 50–60 | 1,687 (24) | 362 (24) | 307 (32) | 49 (22) | 100 (16) | 27 (19) | 116 (34) | 229 (21) | 64 (22) | 35 (18) | 267 (25) | 65 (24) | 66 (29) |
| 60–70 | 2,448 (36) | 567 (38) | 358 (37) | 62 (28) | 215 (35) | 65 (46) | 100 (29) | 513 (47) | 31 (11) | 20 (10) | 335 (32) | 99 (36) | 83 (37) |
| 70–80 | 1,581 (23) | 412 (28) | 187 (19) | 27 (12) | 174 (28) | 38 (27) | 59 (17) | 314 (29) | 22 (8) | 10 (5) | 211 (20) | 75 (28) | 52 (23) |
| >80 | 205 (3) | 35 (2) | 9 (1) | 3 (1) | 68 (11) | 7 (5) | 8 (2) | 31 (3) | 1 (0) | 0 (0) | 32 (3) | 6 (2) | 5 (2) |
| Age at questionnaire, mean (SD), y | 66.7 (11.8) | 69.9 (9.4) | 67.9 (9.6) | 58.6 (13.6) | 68.4 (11.8) | 67.7 (8.5) | 63.8 (11.2) | 71.1 (7.3) | 56.1 (14.6) | 46.8 (16.0) | 64.3 (12.9) | 67.8 (10.3) | 66.4 (9.4) |
| <50 | 636 (9) | 51 (3) | 41 (4) | 59 (27) | 50 (8) | 3 (2) | 39 (11) | 2 (0) | 105 (37) | 115 (58) | 146 (14) | 17 (6) | 8 (4) |
| 50–60 | 980 (14) | 159 (11) | 144 (15) | 50 (23) | 80 (13) | 21 (15) | 80 (23) | 57 (5) | 72 (25) | 34 (17) | 195 (19) | 38 (14) | 50 (22) |
| 60–70 | 2,261 (33) | 471 (32) | 344 (36) | 57 (26) | 192 (31) | 62 (44) | 125 (36) | 427 (39) | 52 (18) | 29 (15) | 333 (32) | 87 (32) | 82 (36) |
| 70–80 | 2,267 (33) | 590 (40) | 334 (35) | 44 (20) | 193 (31) | 45 (32) | 79 (23) | 476 (43) | 36 (13) | 17 (9) | 281 (27) | 98 (36) | 74 (33) |
| >80 | 744 (11) | 216 (15) | 96 (10) | 12 (5) | 99 (16) | 9 (6) | 20 (6) | 134 (12) | 19 (7) | 2 (1) | 95 (9) | 31 (11) | 13 (5) |
| Sex, n (%) | |||||||||||||
| Male | 4,020 (58) | 804 (54) | 572 (60) | 99 (45) | 313 (51) | 0 (0) | 0 (0) | 1,097 (100) | 71 (25) | 107 (54) | 633 (60) | 187 (69) | 137 (61) |
| Female | 2,875 (42) | 683 (46) | 388 (40) | 123 (55) | 301 (49) | 140 (100) | 344 (100) | 0 (0) | 214 (75) | 90 (46) | 418 (40) | 85 (31) | 89 (39) |
| Disease stagea, n (%) | |||||||||||||
| I | 1,778 (26) | 333 (22) | 318 (33) | 170 (77) | 51 (8) | 122 (87) | 149 (43) | 146 (13) | 159 (56) | 37 (19) | 305 (29) | 0 (0) | 0 (0) |
| II | 1974 (29) | 622 (42) | 286 (30) | 34 (15) | 2 (0) | 4 (3) | 34 (10) | 639 (58) | 55 (19) | 101 (51) | 189 (18) | 0 (0) | 0 (0) |
| III | 1,350 (20) | 439 (30) | 301 (31) | 10 (5) | 1 (0) | 6 (4) | 107 (31) | 214 (20) | 46 (16) | 36 (18) | 181 (17) | 0 (0) | 0 (0) |
| IV | 617 (9) | 72 (5) | 38 (4) | 2 (1) | 0 (0) | 5 (4) | 27 (8) | 95 (15) | 19 (7) | 20 (10) | 299 (28) | 0 (0) | 0 (0) |
| Not applicable/ unknown | 1,154 (17) | 21 (1) | 17 (2) | 6 (3) | 560 (91) | 3 (2) | 27 (8) | 3 (9) | 6 (2) | 3 (2) | 77 (7) | 272 (100) | 226 (100) |
| Primary treatments received, n (%) | |||||||||||||
| Surgery | 3,837 (56) | 1,475 (99) | 946 (99) | 221 (100) | 102 (17) | 139 (99) | 332 (97) | 339 (31) | 283 (99) | 0 (0) | 0 (0) | 0 (0) | (0) |
| Systemic therapyb | 2,216 (32) | 490 (32) | 275 (29) | 0 (0) | 5 (1) | 5 (4) | 251 (73) | 0 (0) | 0 (0) | 186 (94) | 768 (73) | 60 (22) | 176 (78) |
| Radiotherapy | 1,832 (27) | 24 (2) | 692 (72) | 0 (0) | 0 (0) | 53 (38) | 2 (1) | 396 (36) | 206 (72) | 117 (59) | 263 (25) | 8 (3) | 72 (32) |
| Hormonal therapy | 318 (5) | 1 (0) | 2 (0) | 0 (0) | 0 (0) | 1 (0) | 1 (0) | 306 (28) | 6 (2) | 0 (0) | 0 (0) | 1 (0) | 0 (0) |
| No therapy/active surveillance | 585 (9) | 4 (1) | 0 (0) | 0 (0) | 0 (0) | 0 (0) | 0 (0) | 221 (20) | 2 (1) | 4 (2) | 117 (11) | 202 (74) | 35 (15) |
| Time between diagnosis and invitation, n (%) | |||||||||||||
| <2 y | 1789 (26) | 125 (8) | 55 (6) | 34 (15) | 610 (99) | 140 (100) | 172 (50) | 44 (4) | 5 (2) | 55 (28) | 359 (34) | 84 (31) | 106 (47) |
| 2–3 y | 1411 (21) | 427 (29) | 222 (23) | 41 (19) | 1 (0) | 0 (0) | 30 (9) | 237 (22) | 32 (11) | 34 (17) | 239 (23) | 82 (30) | 66 (29) |
| 3–5 y | 1537 (22) | 284 (19) | 210 (22) | 84 (38) | 2 (0) | 0 (0) | 37 (11) | 551 (51) | 45 (16) | 31 (16) | 212 (20) | 48 (18) | 33 (15) |
| >5 y | 2126 (31) | 641 (43) | 471 (49) | 61 (28) | 1 (0) | 0 (0) | 105 (31) | 258 (24) | 202 (71) | 77 (39) | 233 (22) | 57 (21) | 20 (9) |
| Comorbidities, n (%) | |||||||||||||
| 0 | 2,113 (31) | 401 (27) | 307 (32) | 81 (36) | 341 (55) | 32 (23) | 115 (33) | 284 (26) | 72 (25) | 86 (44) | 296 (28) | 52 (19) | 46 (20) |
| 1 | 1,843 (27) | 406 (27) | 269 (28) | 63 (28) | 82 (13) | 38 (27) | 88 (26) | 362 (33) | 89 (31) | 49 (25) | 284 (27) | 59 (22) | 52 (24) |
| >1 | 2,939 (43) | 690 (46) | 384 (40) | 78 (35) | 191 (31) | 70 (50) | 141 (41) | 451 (41) | 124 (43) | 62 (31) | 471 (45) | 161 (59) | 126 (56) |
| Partner, n (%) | |||||||||||||
| Yes | 5,328 (78) | 1,119 (76) | 760 (79) | 181 (83) | 469 (78) | 102 (74) | 235 (70) | 920 (85) | 222 (78) | 147 (75) | 785 (76) | 210 (78) | 178 (80) |
| No | 1500 (22) | 359 (24) | 198 (21) | 37 (17) | 136 (22) | 36 (26) | 103 (30) | 166 (15) | 63 (22) | 49 (25) | 249 (24) | 59 (22) | 45 (20) |
| Educational level, n (%) | |||||||||||||
| Low | 1,119 (16) | 284 (19) | 176 (18) | 15 (7) | 159 (26) | 22 (16) | 48 (14) | 147 (14) | 28 (7) | 13 (7) | 153 (15) | 44 (16) | 30 (13) |
| Middle | 4,202 (62) | 905 (61) | 575 (60) | 135 (62) | 395 (65) | 99 (72) | 221 (67) | 647 (60) | 183 (64) | 122 (62) | 623 (60) | 151 (56) | 146 (65) |
| High | 1,487 (22) | 284 (19) | 203 (21) | 68 (31) | 52 (9) | 16 (12) | 67 (20) | 288 (27) | 73 (26) | 61 (31) | 255 (25) | 73 (27) | 47 (21) |
| Employment status, n (%) | |||||||||||||
| Employed | 1,628 (24) | 218 (15) | 178 (19) | 109 (50) | 151 (26) | 27 (20) | 91 (28) | 151 (14) | 146 (52) | 97 (54) | 369 (38) | 47 (19) | 44 (20) |
| Not employed | 5,022 (76) | 1,249 (85) | 770 (81) | 108 (50) | 433 (74) | 105 (80) | 230 (72) | 915 (86) | 133 (46) | 84 (46) | 613 (62) | 207 (82) | 175 (80) |
| Deceased, n (%) | |||||||||||||
| Yes | 1,390 (20) | 324 (22) | 218 (23) | 6 (3) | 22 (4) | 25 (18) | 113 (33) | 148 (13) | 26 (9) | 22 (11) | 263 (25) | 82 (30) | 141 (62) |
| No | 5,505 (80) | 1,163 (78) | 742 (77) | 216 (97) | 592 (96) | 115 (82) | 231 (67) | 949 (87) | 259 (91) | 175 (75) | 788 (75) | 190 (70) | 85 (38) |
| Follow‐up time, mean (SD), y | 4.6 (2.0) | 5.3 (1.5) | 5.2 (1.6) | 2.4 (1.3) | 2.4 (0.2) | 4.5 (1.1) | 3.8 (1.5) | 3.6 (1.6) | 5.9 (0.9) | 6.5 (1.8) | 5.3 (2.2) | 5.0 (2.3) | 3.8 (2.3) |
| Median (min‐max) | 5.2 (0–7.9) | 5.9 (0.1–6.2) | 5.9 (0–6.2) | 2.0 (0.6–7.7) | 2.5 (0.3–3.9) | 4.7 (0.7–5.8) | 4.6 (0.2–5.8) | 4.3 (0.1–5.3) | 6.2 (1.0–6.3) | 7.6 (0.8–7.8) | 5.4 (0.1–7.8) | 4.6 (0.2–7.7) | 3.6 (0–7.7) |
a
According to TNM. Ann Arbor Code was used for Hodgkin lymphoma and Non‐Hodgkin lymphoma. For chronic lymphocytic leukemia and multiple myeloma, tumor stage was not determined or registered.
b
Systemic therapies were: chemotherapy, targeted therapy, and immune therapy.