
Table 4.
Likelihood ratio tests of Cox regression analyses for other EORTC QLQ‐C30 scales
| Variable | Total,a n = 6,895 | Colon cancer, n = 1,487 | Rectal cancer, n = 960 | Melanoma, n = 222 | Basal or squamous cell cancer, n = 614 | Endometrial cancer, n = 140 | Ovarian cancer,a n = 344 | Prostate cancer,a n = 1,097 | Thyroid cancer, n = 285 | Hodgkin lymphoma,a n = 197 | Non‐ Hodgkin lymphoma,a n = 1,051 | Chronic lymphocytic leukemia,a n = 272 | Multiple myeloma,a n = 226 |
|---|---|---|---|---|---|---|---|---|---|---|---|---|---|
| Unadjusted Cox regression, −2 Log likelihood ratio | |||||||||||||
| EORTC QLQ‐C30 summary score | |||||||||||||
| Full model | 21,207.7 | 4,087.3 | 2,543.5 | 42.0 | 267.4 | 232.1 | 1,052.5 | 1,807.1 | 223.0 | 182.6 | 3,146.3 | 769.6 | 1,263.5 |
| Null model | 21,504.1* | 4,147.2* | 2,586.9* | 42.9 | 276.6* | 232.2 | 1,076.6* | 1,852.6* | 227.7 | 182.7 | 3,175.3* | 774.3 | 1,268.6 |
| Global QOL | |||||||||||||
| Full model | 19,928.5 | 3,862.0 | 2,409.9 | 27.7 | 222.0 | 172.1 | 928.4 | 1,637.6 | 169.6 | 131.8 | 2,869.8 | 673.4 | 1,162.1 |
| Null model | 20,840.4* | 4,085.0* | 2,582.3* | 42.6 | 262.5* | 230.5* | 1,012.1* | 1,784.4* | 227.4* | 182.4* | 3,014.1* | 733.6* | 1,194.6* |
| Physical functioning | |||||||||||||
| Full model | 20,956.3 | 4,037.2 | 2,512.1 | 42.8 | 254.8 | 232.2 | 1,054.9 | 1,770.4 | 215.3 | 180.8 | 3,121.0 | 741.9 | 1,247.8 |
| Null model | 21,453.6* | 4,147.2* | 2,586.9* | 42.9 | 263.7* | 232.2 | 1,076.6* | 1,852.1* | 227.7* | 182.7 | 3,174.8* | 763.7* | 1,256.9* |
| Adjusted Cox regression b , −2 Log likelihood ratio | |||||||||||||
| EORTC QLQ‐C30 summary score | |||||||||||||
| Full model | 20,073.7 | 3,874.8 | 2,419.1 | 27.0 | 239.7 | 172.0 | 934.2 | 1,636.8 | 168.5 | 136.2 | 2,895.3 | 675.9 | 1,204.4 |
| Null model | 20,987.7* | 4,086.3* | 2,583.4* | 42.6 | 275.7* | 230.5* | 1,022.8* | 1,784.8* | 227.4* | 182.5* | 3,039.5* | 740.9* | 1,235.8* |
| Global QOL | |||||||||||||
| Full model | 19,928.5 | 3,862.0 | 2,409.9 | 27.7 | 222.0 | 172.1 | 928.4 | 1,637.6 | 169.6 | 131.8 | 2,869.8 | 673.4 | 1,162.1 |
| Null model | 20,840.4* | 4,085.0* | 2,582.3* | 42.6 | 262.5* | 230.5* | 1,012.1* | 1,784.4* | 227.4* | 182.4* | 3,014.1* | 733.6* | 1,194.6* |
| Physical functioning | |||||||||||||
| Full model | 19,977.3 | 3,857.4 | 2,406.9 | 27.0 | 225.9 | 169.1 | 933.9 | 1,623.4 | 168.7 | 136.9 | 2,889.0 | 667.9 | 1,190.8 |
| Null model | 20,953.5* | 4,086.3* | 2,583.4* | 42.6 | 262.8* | 230.5* | 1,022.8* | 1,784.4* | 227.4* | 182.5* | 3,039.0* | 740.9* | 1,224.2* |
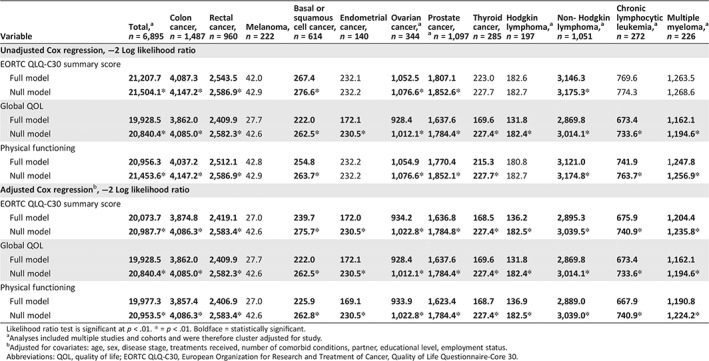
Likelihood ratio test is significant at p < .01. * = p < .01. Boldface = statistically significant.
a
Analyses included multiple studies and cohorts and were therefore cluster adjusted for study.
b
Adjusted for covariates: age, sex, disease stage, treatments received, number of comorbid conditions, partner, educational level, employment status.
Abbreviations: QOL, quality of life; EORTC QLQ‐C30, European Organization for Research and Treatment of Cancer, Quality of Life Questionnaire‐Core 30.