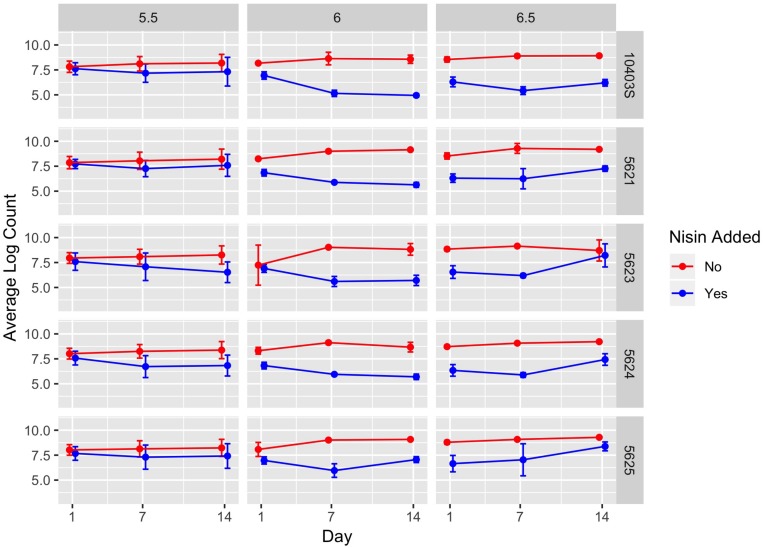
FIGURE 3.
Average counts (log cfu/g) of L. monocytogenes in the presence (blue line) and absence (red line) of nisin treatment in a lab-scale cheese model. Each cheese was inoculated with a single strain of L. monocytogenes (10403S, FSL R9-5621, FSL R9-5623, FSL R9-5624, or FSL R9-5625) to a level of approximately 7 log cfu/g. These results represent the effect of pH (5.5, 6.0, and 6.5) on L. monocytogenes’ sensitivity to nisin. The data points are slightly offset such that the reader can clearly see each point; however, the points still correspond to 1, 7, and 14 days. All values are the arithmetic mean of three independent experiments, and error bars denote standard error. For some data points, error bars are not visible because standard error was too low to yield a visible error bar. All cheese was stored at 6°C.

