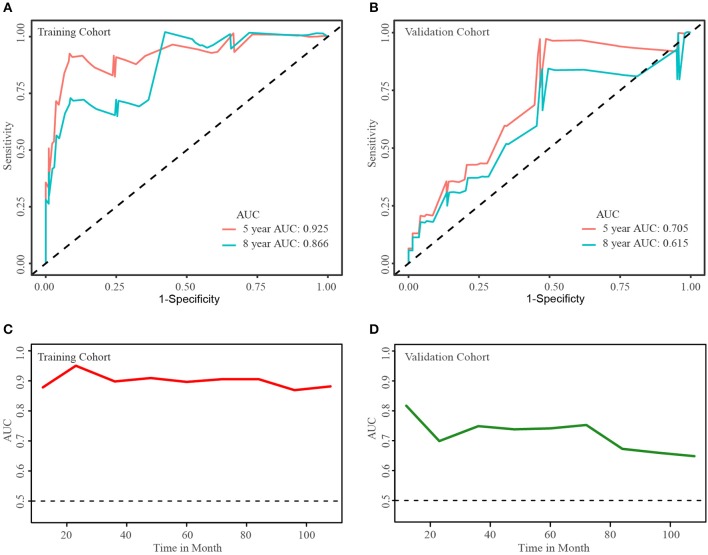
Figure 7.
Time-dependent ROC curve and areas under ROC curve at different time points. Areas under ROC curve of 5- and 8-year cancer-specific survival rates in training cohort (A) and validation cohort (B). Areas under ROC curve at different time points in training cohort (C) and validation cohort (D).

