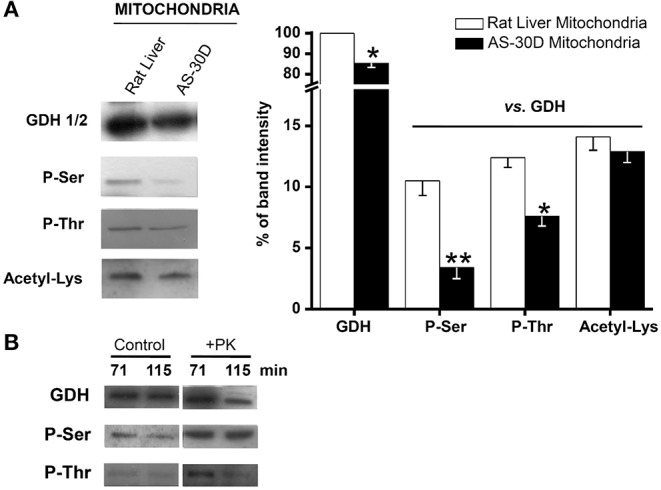
Figure 4.

Phosphorylation and acetylation status of GDH in isolated mitochondria. Representative Western blots and relative protein contents are shown. Data represent the mean ± SD of three different preparations. (A) The RLM GDH protein signal was used for initial normalization of the HepM GDH signal, followed by comparison of the phosphorylation and acetylation signals against their respective GDH (control or 5 mM NH4Cl) signal. (B) Phosphorylation of HepM GDH by commercial phosphorylase kinase. HepM fractions (10 mg protein/mL) were incubated at 30°C for the indicated times with 41 mM α-glycerophosphate, 20 mM Tris pH 7.4, 1 mM CaCl2, 5 mM ATP, 7 mM MgCl2, 300 mM trehalose, and 40 U rabbit muscle phosphorylase kinase (PK). Controls were also carried out under the same conditions, but PK was omitted from the mix reaction. Statistical analysis was performed using one-way ANOVA with Scheffé comparison test.*P < 0.05, **P < 0.01 vs. RLM.
