
Figure 7.
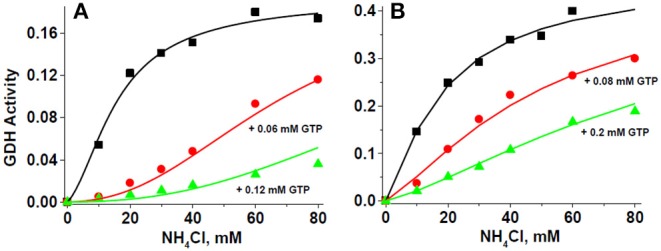
GTP inhibition of GDH activity fits the MWC equation. For these representative experiments, 279 μg protein of HepM (A) and 86 μg protein of RLM (B) were incubated in KME + HEPES buffer at pH 7.50 and 37°C. The solid lines represent the simultaneous global fitting of all experimental points to the exclusive ligand binding MWC Equation 1. The χ2 values of the non-linear regression analyses were 0.00005 and 0.00013 for HepM GDH and RLM GDH, respectively. The Vmax values in ΔAbs/min at saturating ADP concentration were 0.199 ± 0.013 (1.5 mM ADP) for HepM GDH; and 0.471 ± 0.041 (2.1 mM ADP) for RLM GDH.