Figure 1.
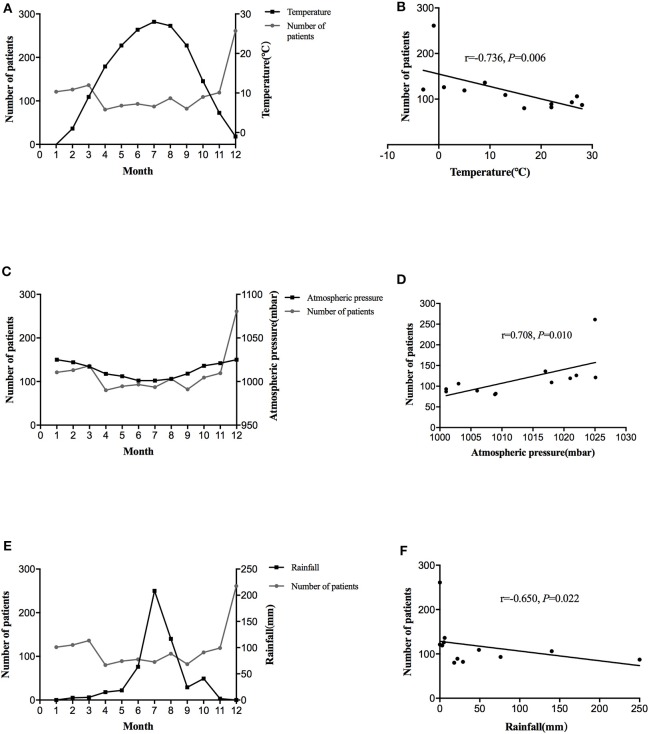
The distribution of average monthly diagnoses of BPPV and temperature over the 3 year period (A). Association between the number of BPPV patients with temperature (B). The distribution of average monthly diagnoses of BPPV and atmospheric pressure over the 3 year period (C). Association between the number of BPPV patients with atmospheric pressure (D). The distribution of average monthly diagnoses of BPPV and rainfall over the 3 year period (E). Association between the number of BPPV patients with rainfall (F).

