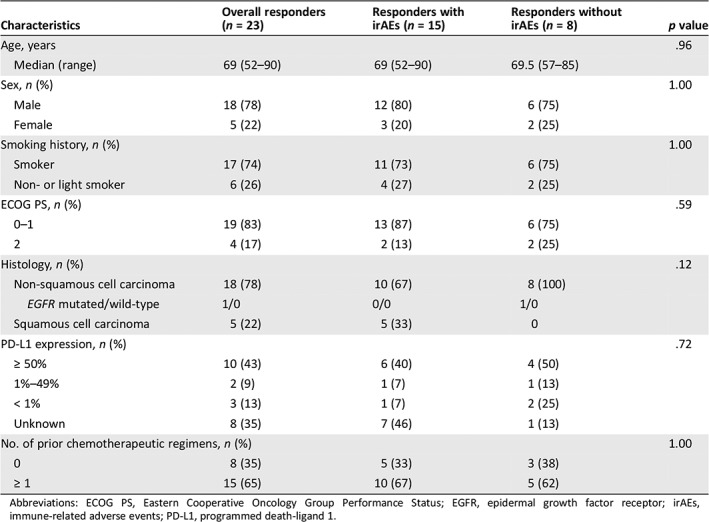
Table 1.
Patient characteristics
| Characteristics | Overall responders (n = 23) | Responders with irAEs (n = 15) | Responders without irAEs (n = 8) | p value |
|---|---|---|---|---|
| Age, years | .96 | |||
| Median (range) | 69 (52–90) | 69 (52–90) | 69.5 (57–85) | |
| Sex, n (%) | 1.00 | |||
| Male | 18 (78) | 12 (80) | 6 (75) | |
| Female | 5 (22) | 3 (20) | 2 (25) | |
| Smoking history, n (%) | 1.00 | |||
| Smoker | 17 (74) | 11 (73) | 6 (75) | |
| Non‐ or light smoker | 6 (26) | 4 (27) | 2 (25) | |
| ECOG PS, n (%) | .59 | |||
| 0–1 | 19 (83) | 13 (87) | 6 (75) | |
| 2 | 4 (17) | 2 (13) | 2 (25) | |
| Histology, n (%) | .12 | |||
| Non‐squamous cell carcinoma | 18 (78) | 10 (67) | 8 (100) | |
| EGFR mutated/wild‐type | 1/0 | 0/0 | 1/0 | |
| Squamous cell carcinoma | 5 (22) | 5 (33) | 0 | |
| PD‐L1 expression, n (%) | .72 | |||
| ≥ 50% | 10 (43) | 6 (40) | 4 (50) | |
| 1%–49% | 2 (9) | 1 (7) | 1 (13) | |
| < 1% | 3 (13) | 1 (7) | 2 (25) | |
| Unknown | 8 (35) | 7 (46) | 1 (13) | |
| No. of prior chemotherapeutic regimens, n (%) | 1.00 | |||
| 0 | 8 (35) | 5 (33) | 3 (38) | |
| ≥ 1 | 15 (65) | 10 (67) | 5 (62) | |

Abbreviations: ECOG PS, Eastern Cooperative Oncology Group Performance Status; EGFR, epidermal growth factor receptor; irAEs, immune‐related adverse events; PD‐L1, programmed death‐ligand 1.
