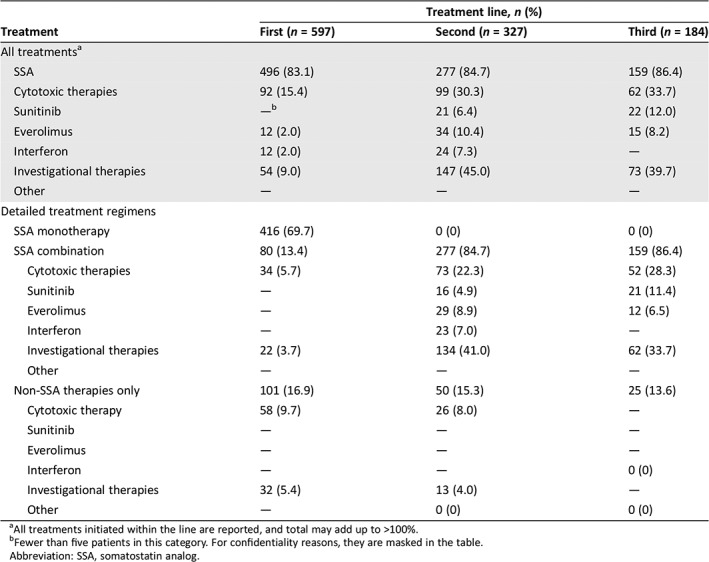
Table 2.
Overall treatment strategy distribution, by treatment line
| Treatment | Treatment line, n (%) | ||
|---|---|---|---|
| First (n = 597) | Second (n = 327) | Third (n = 184) | |
| All treatmentsa | |||
| SSA | 496 (83.1) | 277 (84.7) | 159 (86.4) |
| Cytotoxic therapies | 92 (15.4) | 99 (30.3) | 62 (33.7) |
| Sunitinib | —b | 21 (6.4) | 22 (12.0) |
| Everolimus | 12 (2.0) | 34 (10.4) | 15 (8.2) |
| Interferon | 12 (2.0) | 24 (7.3) | — |
| Investigational therapies | 54 (9.0) | 147 (45.0) | 73 (39.7) |
| Other | — | — | — |
| Detailed treatment regimens | |||
| SSA monotherapy | 416 (69.7) | 0 (0) | 0 (0) |
| SSA combination | 80 (13.4) | 277 (84.7) | 159 (86.4) |
| Cytotoxic therapies | 34 (5.7) | 73 (22.3) | 52 (28.3) |
| Sunitinib | — | 16 (4.9) | 21 (11.4) |
| Everolimus | — | 29 (8.9) | 12 (6.5) |
| Interferon | — | 23 (7.0) | — |
| Investigational therapies | 22 (3.7) | 134 (41.0) | 62 (33.7) |
| Other | — | — | — |
| Non‐SSA therapies only | 101 (16.9) | 50 (15.3) | 25 (13.6) |
| Cytotoxic therapy | 58 (9.7) | 26 (8.0) | — |
| Sunitinib | — | — | — |
| Everolimus | — | — | — |
| Interferon | — | — | 0 (0) |
| Investigational therapies | 32 (5.4) | 13 (4.0) | — |
| Other | — | 0 (0) | 0 (0) |

All treatments initiated within the line are reported, and total may add up to >100%.
Fewer than five patients in this category. For confidentiality reasons, they are masked in the table.
Abbreviation: SSA, somatostatin analog.
