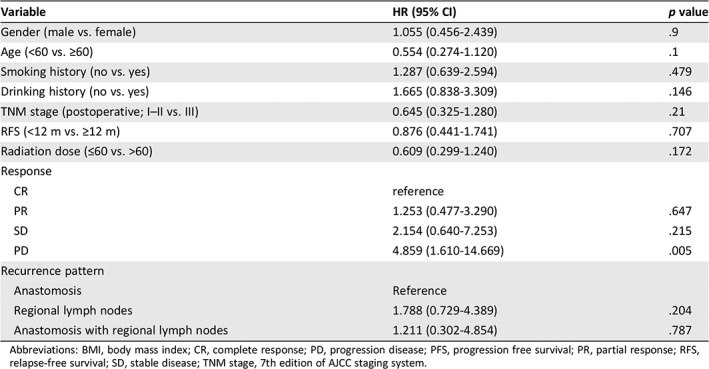
Table 2.
Univariate analysis of prognostic factors for PFS (n = 48)
| Variable | HR (95% CI) | p value |
|---|---|---|
| Gender (male vs. female) | 1.055 (0.456‐2.439) | .9 |
| Age (<60 vs. ≥60) | 0.554 (0.274‐1.120) | .1 |
| Smoking history (no vs. yes) | 1.287 (0.639‐2.594) | .479 |
| Drinking history (no vs. yes) | 1.665 (0.838‐3.309) | .146 |
| TNM stage (postoperative; I–II vs. III) | 0.645 (0.325‐1.280) | .21 |
| RFS (<12 m vs. ≥12 m) | 0.876 (0.441‐1.741) | .707 |
| Radiation dose (≤60 vs. >60) | 0.609 (0.299‐1.240) | .172 |
| Response | ||
| CR | reference | |
| PR | 1.253 (0.477‐3.290) | .647 |
| SD | 2.154 (0.640‐7.253) | .215 |
| PD | 4.859 (1.610‐14.669) | .005 |
| Recurrence pattern | ||
| Anastomosis | Reference | |
| Regional lymph nodes | 1.788 (0.729‐4.389) | .204 |
| Anastomosis with regional lymph nodes | 1.211 (0.302‐4.854) | .787 |

Abbreviations: BMI, body mass index; CR, complete response; PD, progression disease; PFS, progression free survival; PR, partial response; RFS, relapse‐free survival; SD, stable disease; TNM stage, 7th edition of AJCC staging system.
