
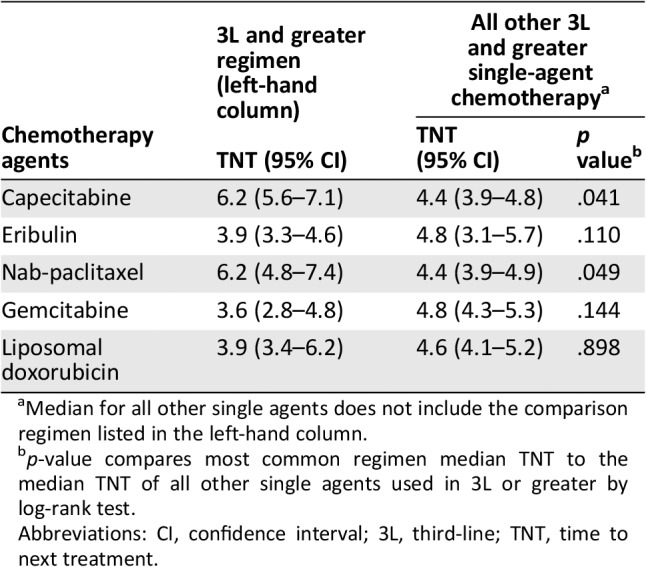
Table 3.
Median TNT (95% CI) in months for the most frequently received chemotherapy agents in 3L or greater compared with all other single agents received in 3L or greater
| Chemotherapy agents | 3L and greater regimen (left‐hand column) | All other 3L and greater single‐agent chemotherapya | |
|---|---|---|---|
| TNT (95% CI) | TNT (95% CI) | p valueb | |
| Capecitabine | 6.2 (5.6–7.1) | 4.4 (3.9–4.8) | .041 |
| Eribulin | 3.9 (3.3–4.6) | 4.8 (3.1–5.7) | .110 |
| Nab‐paclitaxel | 6.2 (4.8–7.4) | 4.4 (3.9–4.9) | .049 |
| Gemcitabine | 3.6 (2.8–4.8) | 4.8 (4.3–5.3) | .144 |
| Liposomal doxorubicin | 3.9 (3.4–6.2) | 4.6 (4.1–5.2) | .898 |
a
Median for all other single agents does not include the comparison regimen listed in the left‐hand column.
b
p‐value compares most common regimen median TNT to the median TNT of all other single agents used in 3L or greater by log‐rank test.
Abbreviations: CI, confidence interval; 3L, third‐line; TNT, time to next treatment.