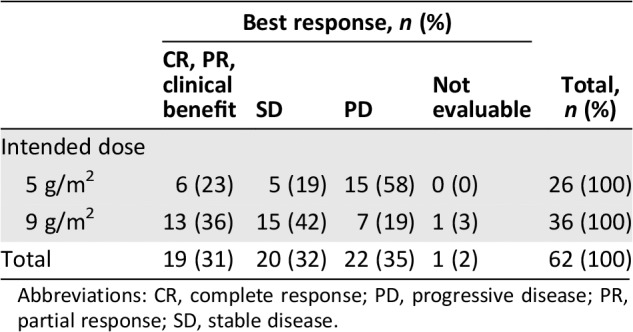
Table 4.
Best overall response
| Best response, n (%) | Total, n (%) | ||||
|---|---|---|---|---|---|
| CR, PR, clinical benefit | SD | PD | Not evaluable | ||
| Intended dose | |||||
| 5 g/m2 | 6 (23) | 5 (19) | 15 (58) | 0 (0) | 26 (100) |
| 9 g/m2 | 13 (36) | 15 (42) | 7 (19) | 1 (3) | 36 (100) |
| Total | 19 (31) | 20 (32) | 22 (35) | 1 (2) | 62 (100) |

Abbreviations: CR, complete response; PD, progressive disease; PR, partial response; SD, stable disease.
