Figure 3.

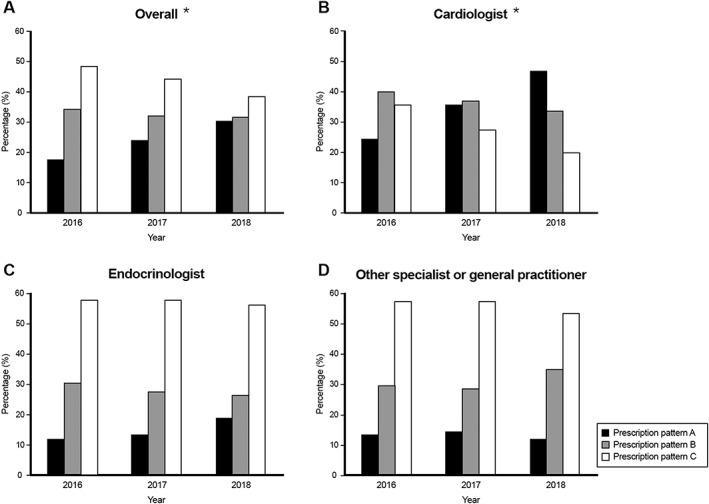
(A–D) The distribution of diabetes medications prescription pattern over time. Asterisk indicates statistical difference among years, P value < 0.05.

(A–D) The distribution of diabetes medications prescription pattern over time. Asterisk indicates statistical difference among years, P value < 0.05.