
Figure 2.
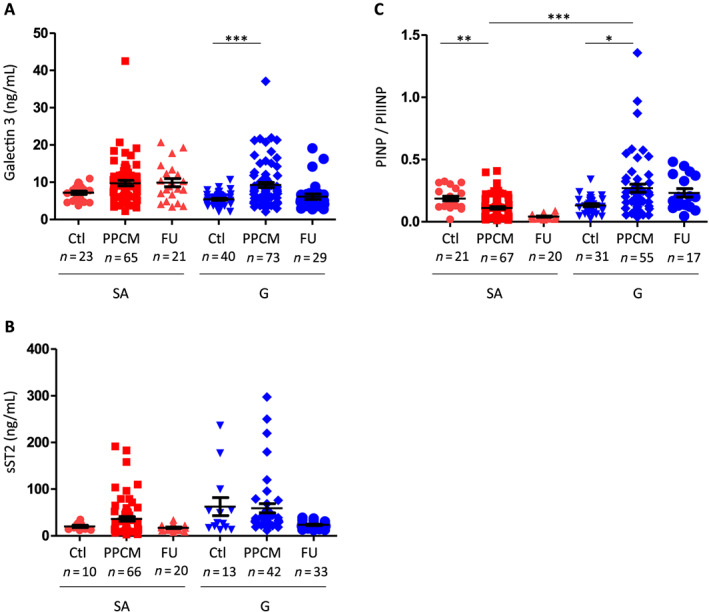
Galectin‐3, soluble ST2 (sST2), osteopontin levels, and ratio of procollagen type‐I N‐terminal propeptide (PINP) to procollagen type‐III N‐terminal propeptide (PIIINP) levels in German (G) and South African (SA) controls and peripartum cardiomyopathy (PPCM) patients at baseline and follow‐up (FU). Bar graphs display (A) galectin‐3 plasma and (B) sST2 serum levels in G‐PPCM and SA‐PPCM patients at baseline and after 6 months of FU as well as in their respective controls. (C) Ratio of PINP to PIIINP levels in G and SA controls and PPCM patients at baseline and FU. The FU data are only represented but were not compared with the control and PPCM groups, as described in the Methods section. A number of subjects are indicated, * P < 0.05, ** P < 0.01, and *** P < 0.001 using Kruskal–Wallis test and Dunn's multiple comparison test.