
Figure 2.
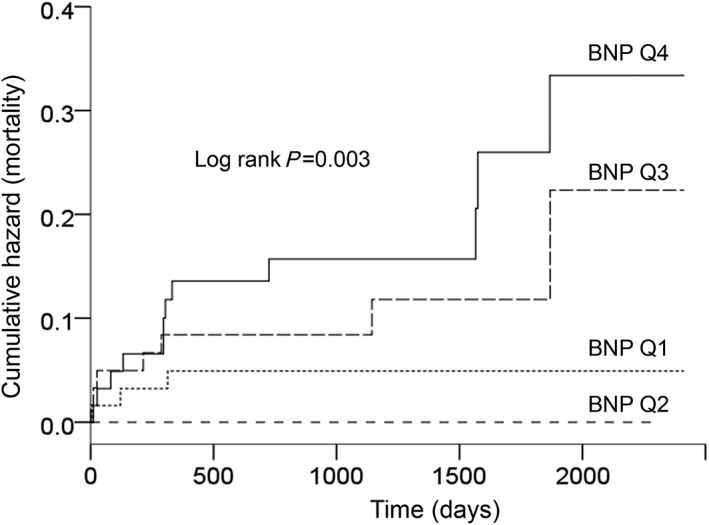
Kaplan–Meier plots showing the cumulative incidence of death in the four B‐type natriuretic peptide quartiles (BNP; Q1, lowest BNP values; and Q4, highest BNP values).
Official websites use .gov
A
.gov website belongs to an official
government organization in the United States.
Secure .gov websites use HTTPS
A lock (
) or https:// means you've safely
connected to the .gov website. Share sensitive
information only on official, secure websites.
Kaplan–Meier plots showing the cumulative incidence of death in the four B‐type natriuretic peptide quartiles (BNP; Q1, lowest BNP values; and Q4, highest BNP values).