
Figure 4.
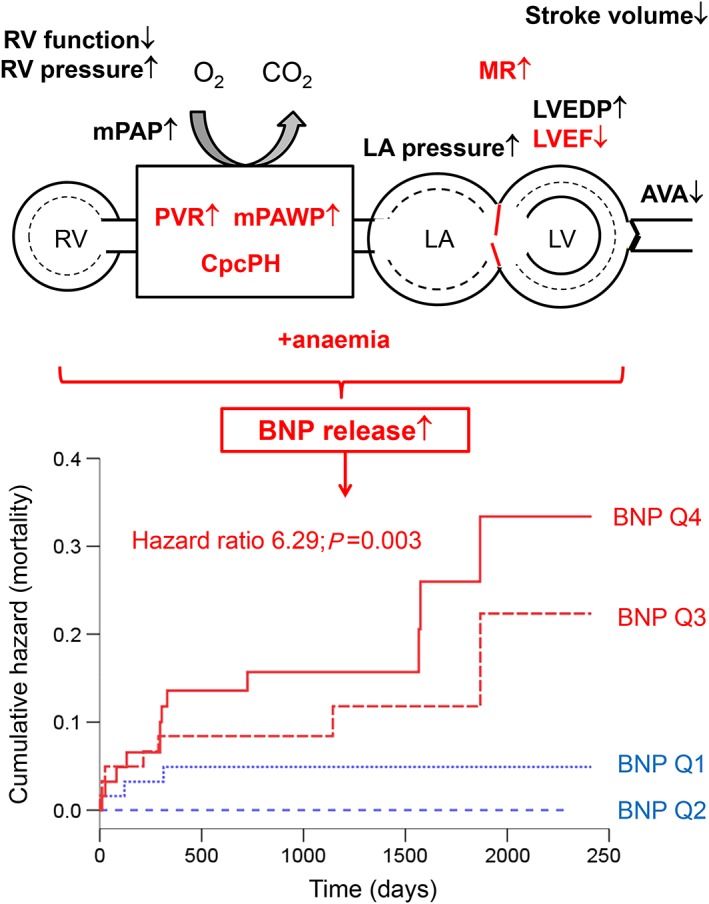
Schematic representation of the key haemodynamic measures (red) reflecting the maladaptive effects of severe aortic stenosis associated with increased plasma concentrations of B‐type natriuretic peptide (BNP; top) and the strong long‐term prognostic impact of high BNP (bottom). The hazard ratio refers to the comparison of quartiles (Q) 4 and 3 (red, poor prognosis) vs. Q2 and 1 (blue, favourable prognosis).