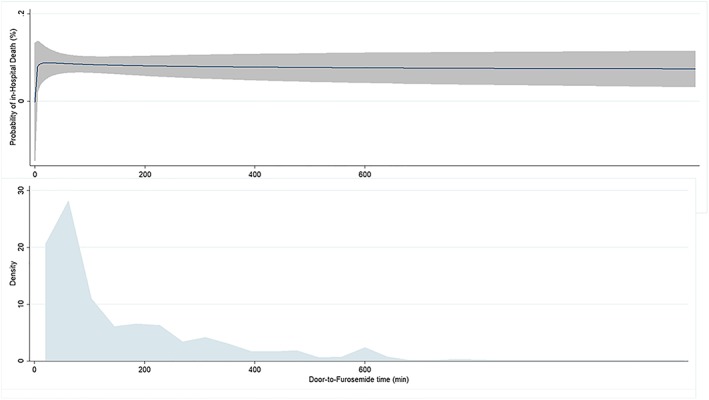
Figure 3.

Up—probability of in‐hospital mortality according to the time of furosemide administration; the solid blue line represents the estimated probability of in‐hospital mortality, and the shaded area is the 95% confidence interval. Bottom—density plot showing the distribution of observed door‐to‐furosemide time.
