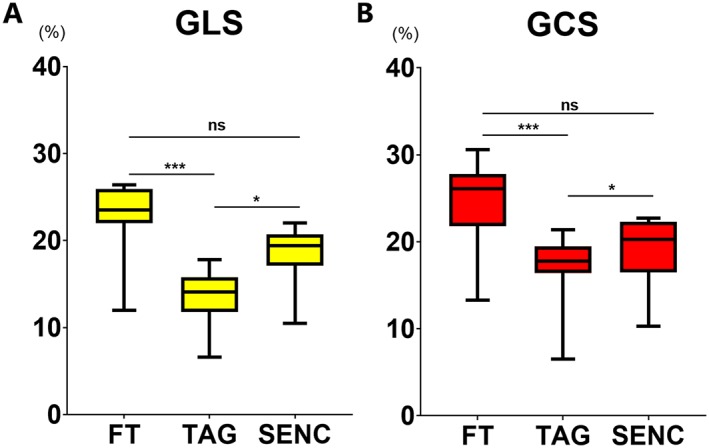
Figure 1.

Comparison of GLS (A) and GCS (B) measured using three CMR modalities. Results of Friedman's test with Dunn's post hoc analysis: ns—P ≥ 0.05, *—P < 0.05, ***—P < 0.001. FT, feature tracking; GCS, global circumferential strain; GLS, global longitudinal strain; SENC, strain‐encoded magnetic resonance imaging; TAG, myocardial tagging.
