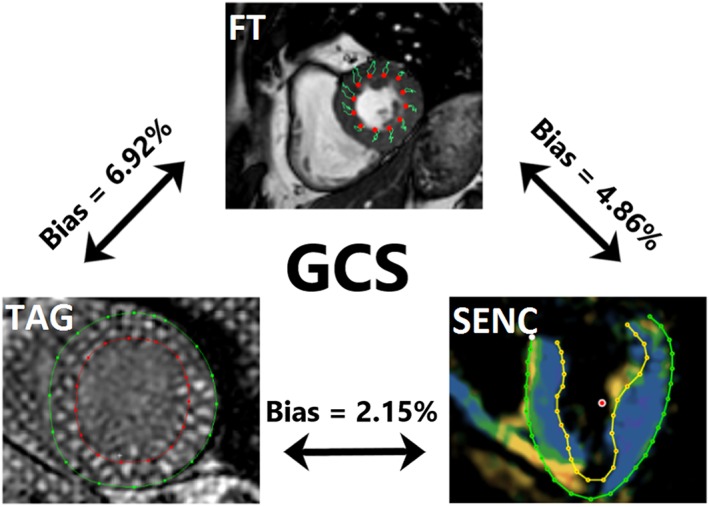
Figure 5.

Visual representation of global longitudinal strain assessment with the three different cardiovascular magnetic resonance techniques. TAG on the left, SENC on the right, and FT on the top picture. Mean difference (bias) between techniques, derived from Bland–Altman analyses, is shown. FT, feature tracking; GCS, global circumferential strain; SENC, strain‐encoded magnetic resonance imaging; TAG, myocardial tagging.
