
Figure 4.
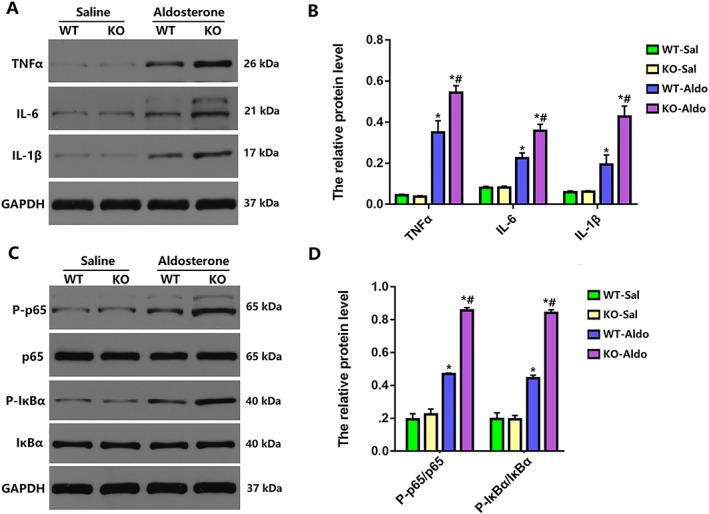
Myocardial inflammation in wild‐type (WT) and myeloid differentiation protein 1 knock‐out mice 4 weeks after saline or aldosterone infusion. (A,B) Representative western blots and statistical analysis of the inflammation‐related protein levels (n = 4). (C,D) Representative western blots and statistical analysis of p65, P‐p65, inhibitor of kappa B (IκBα), and P‐IκBα (n = 4). Data are expressed as mean ± standard error of the mean. * P < 0.05 vs. WT‐Sal group and # P < 0.05 vs. WT‐Aldo group.