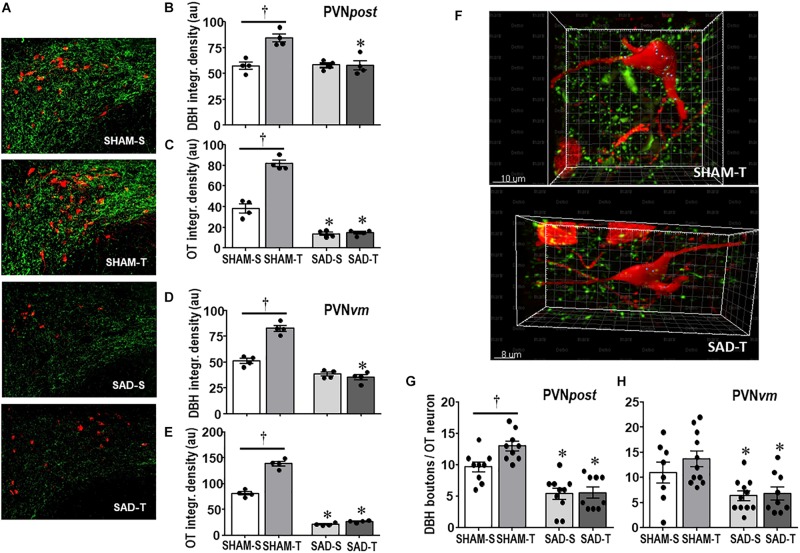
FIGURE 2.
(A) Photomicrographs showing changes in DBH + fibers (green) and OT+ neurons (red) within the posterior paraventricular nucleus (PVNpost) in sinoaortic denervated (SAD) and sham-operated (SHAM) rats submitted to exercise training (T) or sedentary (S) protocol. Bar graphs compare the integrated density of DBH + projections (B, D) and OT+ neurons (C, E) within the PVNpost (B, C) and PVNvm, (D, E) in the 4 experimental groups. Values are the means of 2–4 slices/rat, four rats in each subgroup. (F) Three-dimensional rendered images comparing the density of overlapping boutons (blue) and those that are close, but not overlapping (green) with OT+ neurons (red) taken from PVNpost of SHAM-T and SAD-T rats. Right bottom graphs compare the effects of SAD and training on the number of DBH + boutons/OT+ neuron within the PVNpost (G) and PVNvm (H) in the four experimental groups. Values are the means of 6–12 neurons for ROI, 3–4 ROIs/rat, three rats in each subgroup. Comparisons made by Factorial two-way ANOVA. PVNpost – DBH density: group F(1,12) = 12.54, P = 0.004, condition F(1,12) = 13.67, P = 0.003, interaction F(1,12) = 14.04, P = 0.003; OT density: group F(1,12) = 106.44, P < 0.001, condition F(1,12) = 11.74, P = 0.005, interaction F(1,12) = 5.98, P = 0.031. PVNvm – DBH density: group F(1,12) = 142.60, P < 0.001, condition F(1,12) = 31.56, P < 0.001, interaction F(1,12) = 47.47, P < 0.001; OT density: group F(1,12) = 846.68, P < 0.001, condition F(1,12) = 115.72, P < 0.001, interaction F(1,12) = 77.47, P < 0.001. DBH + boutons/OT+ neuron – PVNpost: group F(1,33) = 48.67, P < 0.001, condition F(1,33) = 4.32, P = 0.046, interaction F(1,33) = 3.58, P = 0.067; PVNvm: group F(1,35) = 15.14, P < 0.001, condition F(1,35) = 1.11, P = 0.299, interaction F(1,35) = 0.60, P = 0.442. Significances (P < 0.05) are ° vs. Sedentary and * vs. respective SHAM group.

