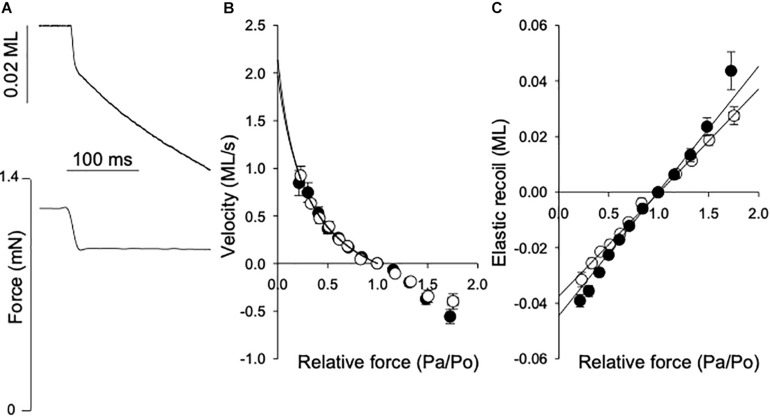
FIGURE 3.
Force-velocity relationship and series elasticity. (A) Shows original traces of the fiber length shortening response (lower) to a rapid change in contraction force (top), from a normal breast muscle. The force step and length response are indicated in the figure. Shortening velocity = reduction in muscle length (ML)/shortening time (s). The afterload force (Pa) and reduction in muscle length were determined between 20 and 70 ms after the force step. (B) Shows the velocity (ML s-1) at different after loads related to the isometric force (Po). Data from 6 experiments were grouped according to Pa/Po and the data for shortening (i.e., velocity ≥ 0) were fitted by the hyperbolic Hill equation (Eq. 1). The equation was extrapolated to Pa/Po = 0 to determine the maximal shortening velocity, Vmax (fit to data in figure: normal breast, open symbols: 2.1; woody breast, filled symbols: 2.0 ML s–1). (C) Depicts the initial elastic recoil for different force steps. The data between 0.5 and 1.5 Pa/Po were fitted by a straight line [Normal breast, open symbols: 0.037; woody breast, filled symbols: 0.045 ML (Pa/Po)-1].

