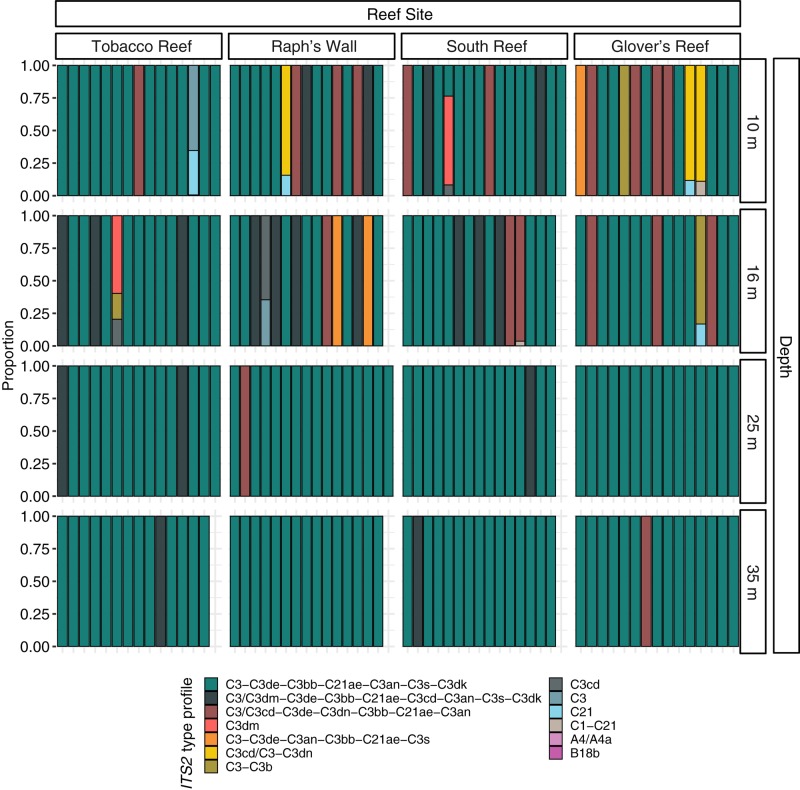
FIGURE 4.
Normalized relative proportion of ITS2 type profiles from Montastraea cavernosa samples. ITS2 type profiles are listed in order of overall abundance. ITS2 type profiles are named for the defining intragenomic variants (DIVs) used to characterize them. DIVs in a type profile name are listed in order of abundance with ‘/’ separating DIVs with co-dominance in samples.

