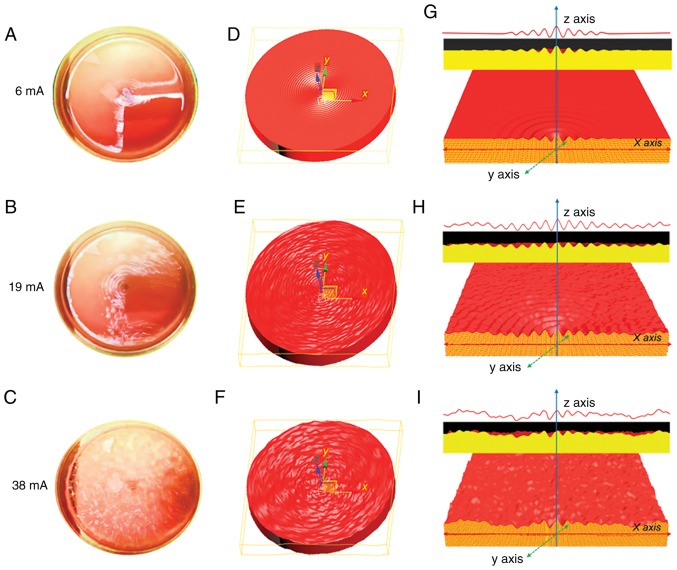
Figure 3.
Characterization of the eVBF device under different vibration amplitudes. (A-C) Digital image of the vibration of the blood samples with different amplitudes (6, 19 and 38 mA). (D-F) Schematic illustration of the vibration of the blood sample with different amplitudes (6, 19 and 38 mA). (G-I) Sectional view of the vibration of the blood samples with different amplitudes (6, 19 and 38 mA). eVBF, electromagnetic vibration-based filtration.

