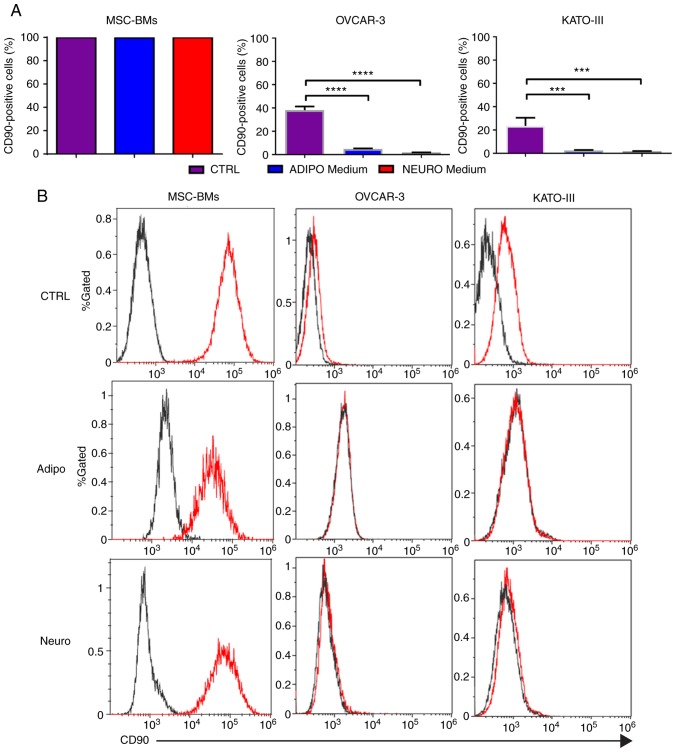
Figure 1.
CD90 marker expression before and after differentiation. (A) CD90 marker expression in MSC-BMs, OVCAR-3-NIH and KATO-III cell lines before (CTRL) and after differentiation (adipocyte and neurocyte). (B) FACS peak graphs showing the CD90 marker expression [(red) and black (isotype control)]. Adipo, adipocyte differentiation medium; Neuro, neurocyte differentiation medium; MSC-BMs, bone-marrow derived mesenchymal stem cells. (***P<0.001, ****P<0.0001).

