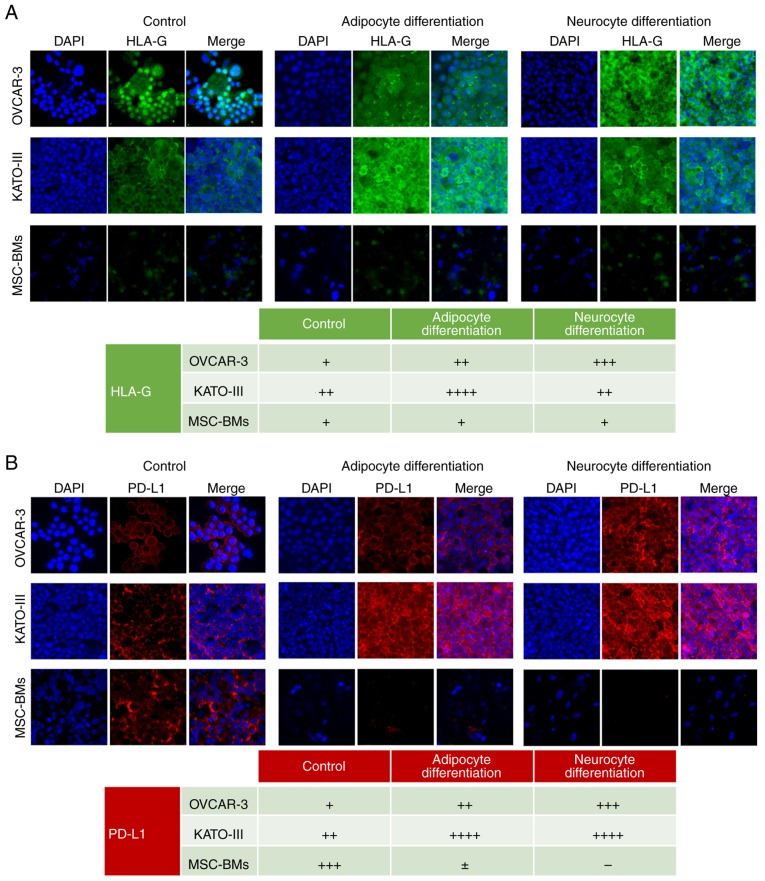
Figure 4.
Expression of HLA-G and PD-L1 in cell lines before and after differentiation through immunofluorescence. OVCAR-3-NIH, KATO-III and MSC-BMs without treatment as control (left), treatment with adipocyte-inducing medium (middle) or treatment with neurocyte-inducing medium (right). (A) HLA-G expression in OVCAR-3-NIH, KATO-III and MSC-BMs with nuclear stained using DAPI (blue) and HLA-G in green. (B) PD-L1 expression in OVCAR-3-NIH, KATO-III and MSC-BMs is shown as red staining with nuclei in blue. Magnification, ×20. Tables show semi-quantitative analysis of HLA-G and PD-L1 expression (− negative, + low expression, ++ intermediate expression, +++ high expression). HLA-G, human leukocyte antigen-G; PD-L1, programmed death ligand-1; MSC-BMs, bone-marrow derived mesenchymal stem cells.

