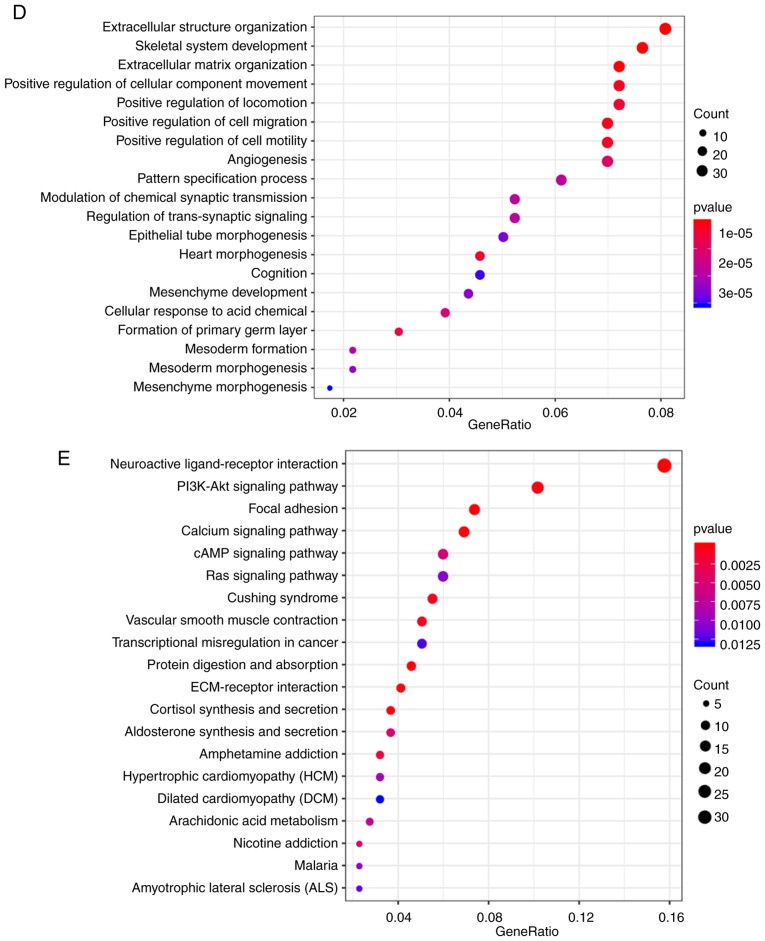
Figure 4.
(A) Volcano plot of differentially expressed genes between the C1 and C2 subtypes. (B) Volcano plot of differentially expressed genes between the C1 and C3 subtypes. (C) The intersection between differentially expressed genes. (D) Top 20 enriched Gene Ontology terms in the ‘biological process’ category. (E) Top 20 Kyoto Encyclopedia of Genes and Genomes biological pathways. Colors indicate saliency; size indicates the number of genes in the pathway. FDR, false discovery rate.


