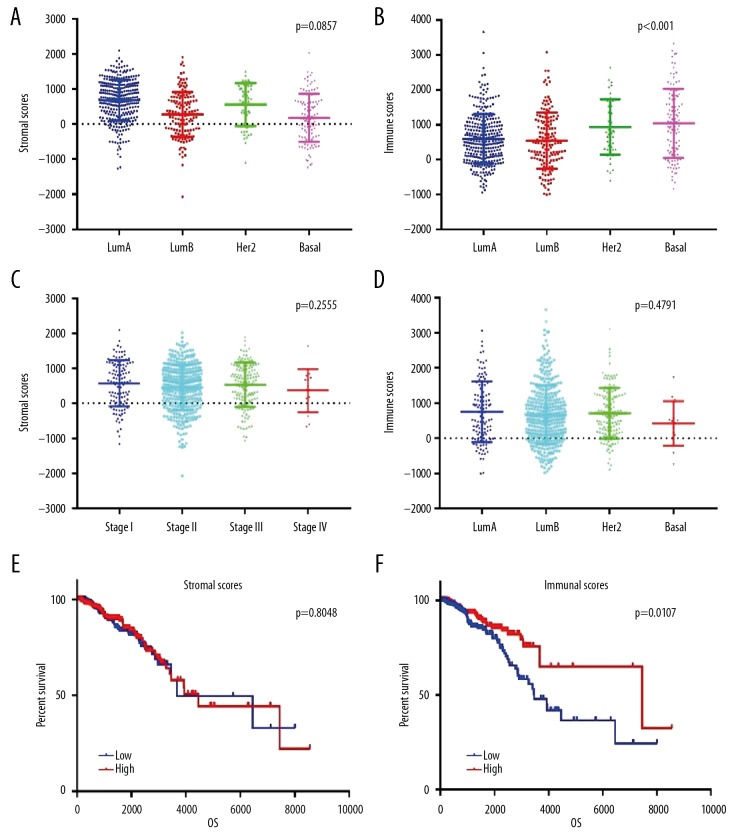
Figure 1.
Comparison of stromal and immune scores in different subtypes and clinical stagesof BC and differences in prognosis. (A) Stromal scores of different BC subtypes. Scatter dot plot shows no association between BC subtypes and stromal scores (n=622, p=0.0857). (B) Immune scores of different BC subtypes. Scatter dot plot shows a significant association between BC subtypes and immune scores (n=622, p<0.001). (C) Distribution of stromal scores in different clinical stages of BC. Scatter dot plot shows no significant association between clinical stages and stromal scores (n=622, p=0.2555). (D) Distribution of immune scores in different clinical stages of BC. Scatter dot plot shows no significant association between clinical stages and immune scores (n=622, p=0.4791). (E, F) In total, 622 BC patients were stratified into a high score group (n=311) or a low score group (n=311) according to the median score. The Kaplan-Meier survival curve demonstrates that the low immune score group was associated with decreased OS (p=0.0107). However, there was no difference in the prognosis between the high and low stromal score groups.

