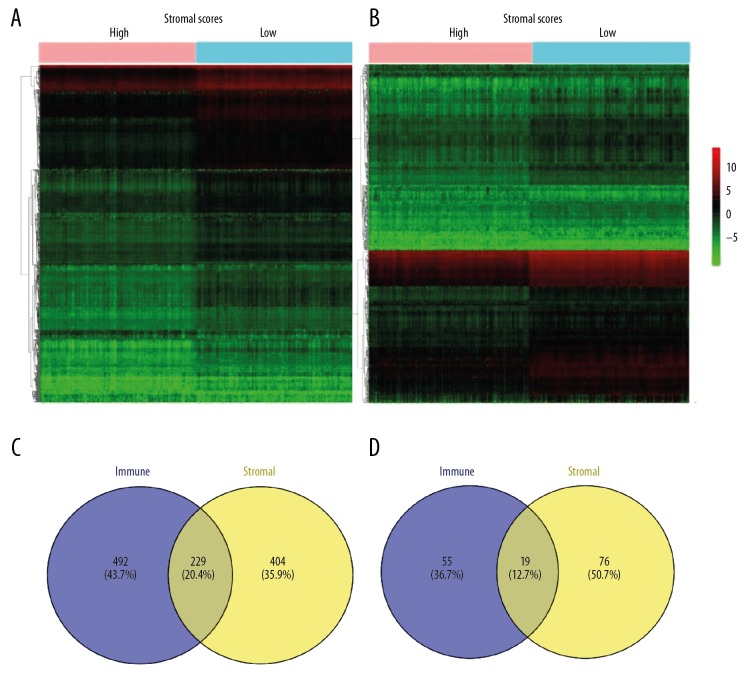
Figure 2.
Comparison of gene expression data of BC in 2 groups based on immune and stromal scores. (A) Heatmap of the DEGs in the high stromal score group vs. the low stromal score group. (B) Heatmap of the DEGs in the high immune score group vs. the low immune score group. (C, D) Identification of 248 intersecting DEGs in the 2 groups (stromal score differential genes and immune score differential genes) through a Venn diagram. In total, 229 DEGs were upregulated, and 19 DEGs were downregulated.

