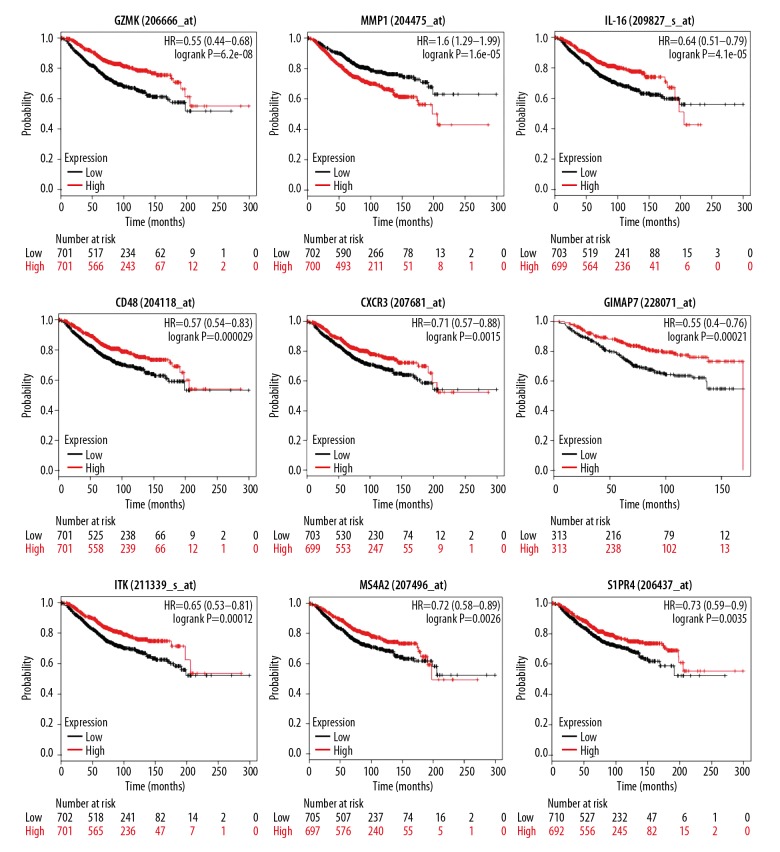
Figure 5.
Independent validation of 61 prognostic genes by Kaplan-Meier curves in the GEO cohort. Kaplan-Meier curves of selected survival-associated genes. Patients were divided into high expression (red line) and low expression (blue line) groups based on their gene expression by the median value.

