
Fig. 4.
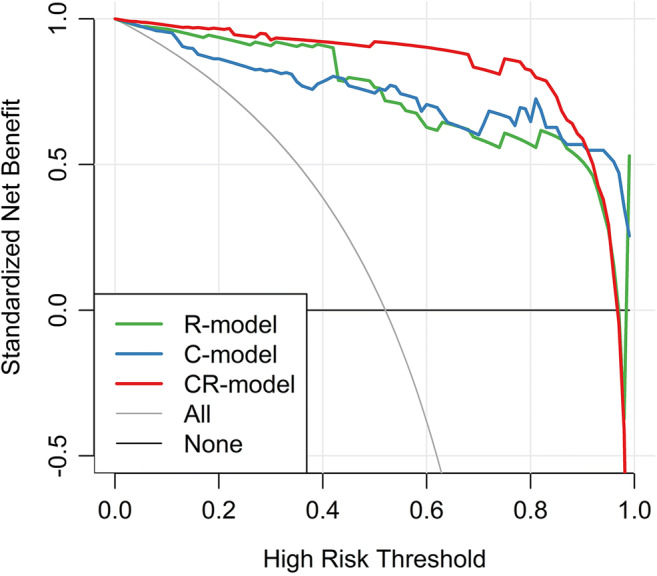
Decision curve analysis for each model in the primary dataset. The y-axis measures the net benefit, which is calculated by summing the benefits (true-positive findings) and subtracting the harms (false-positive findings), weighting the latter by a factor related to the relative harm of undetected metastasis compared with the harm of unnecessary treatment. The decision curve shows that if the threshold probability is over 10%, the application of the combination of clinical and radiological model (CR model) to diagnose COVID-19 adds more benefit than the clinical model (C model) and radiological model (R model)