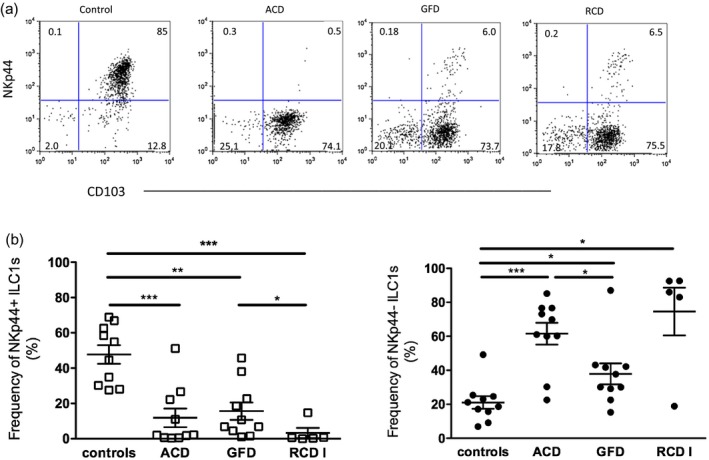
Figure 4.

Innate lymphoid cell (ILC) composition in controls and patients with celiac disease (CD). (a) Dot‐plots represent one of five to 10 independent experiments. (b) The frequencies of NKp44+ and NKp44− ILC1s in controls, patients with active CD (ACD), patients on a gluten‐free diet (GFD) and patients with refractory CD type 1 (RCD I). Left: controls = 47·68 ± 5·25 (n = 10), ACD = 11·85 ± 5·31 (n = 10), GFD = 15·56 ± 4·92 (n = 10), RCD = I 3·27 ± 2·86 (n = 5); right: controls = 21·07 ± 3·68 (n = 10), ACD = 61·55 ± 6·43 (n = 10), GFD = 37·87 ± 6·16 (n = 10), RCD I = 74·6 ± 14·05 (n = 5) [mean percentage ± standard error of the mean (SEM.)]. ***P < 0·0001; **P < 0·01; *P < 0·05.
