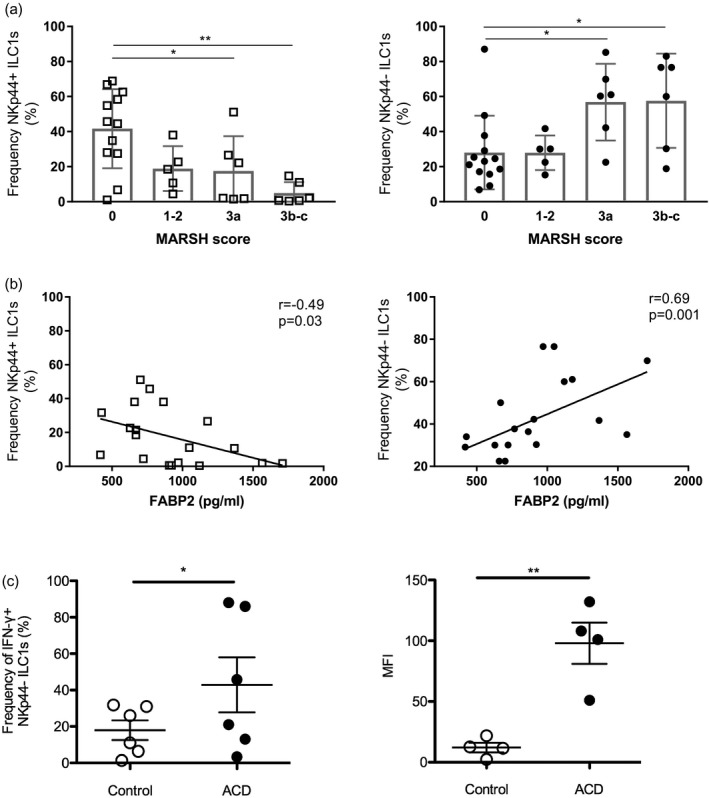
Figure 5.

Correlation between natural killer (NK)p44+ and NKp44− innate lymphoid cell (ILC) frequencies and intestinal epithelial cell damage in celiac disease (CD) patients. (a) Frequency of NKp44+ and NKp44− intraepithelial ILCs in CD patients, including patients with active CD (ACD) and patients on a gluten‐free diet (GFD), and controls stratified for the degree of villous atrophy based on Marsh scores 0–3. Left: Marsh 0 = 41·68 ± 6·51 (n = 13), 1–2 = 18·88 ± 5·72 (n = 5), 3a = 17·55 ± 8·11 (n = 6), 3b–c = 4·95 ± 2·56 (n = 6); right: Marsh 0 = 28·04 ± 5·82 (n = 13), 1–2 = 27·92 ± 4·40 (n = 5); 3a = 56·85 ± 8·94 (n = 6), 3b–c = 57·57 ± 10·98 (n = 6) [mean percentage ± standard error of the mean (SEM.)]. (b) Correlation between serum fatty acid binding protein 2 (FABP2) levels and frequencies of NKp44+ and NKp44− ILCs in CD patients (n = 15) and controls (n = 3). (c) Stimulation of control and active CD (ACD) NKp44− CD103+ ILC1s with phorbol myristate acetate and ionomycin (PMA/IO) in vitro. Left: percentage of interferon (IFN)‐γ producing NKp44− CD103+ ILC1s. Control = 24·95 ± 4·82 (n = 6), ACD = 60·18 ± 16·29 (n = 6) (mean percentage ± s.e.m.); right: MFI of IFN‐γ expression in NKp44− CD103+ ILC1s. Control = 12·03 ± 3·98 (n = 4), ACD = 98 ± 17·01 (n = 4) (mean percentage ± SEM.). **P < 0·01.
