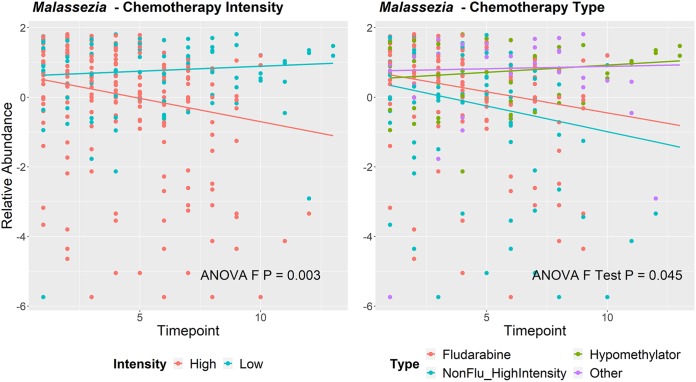
FIG 4.
Changes in Malassezia over time stratified by chemotherapy intensity and chemotherapy type. Centered log ratio (clr) data represent transformed relative abundances of Malassezia with fitted lines from the mixed-effects model over time according to each variable of interest. P value data were derived from ANOVA F-test results. Panel A has fitted lines representing the intensities of the chemotherapy regimens, with high-intensity regimens indicated in coral and low-intensity regimens in aqua. Panel B further dissects these by chemotherapy subtype, with high-intensity fludarabine-containing regimens indicated in coral, hypomethylator-based therapies in green, non-fludarabine-containing high-intensity regimens in aqua, and other low-intensity/low-dose cytarabine-based therapies in purple.

