
FIG 5.
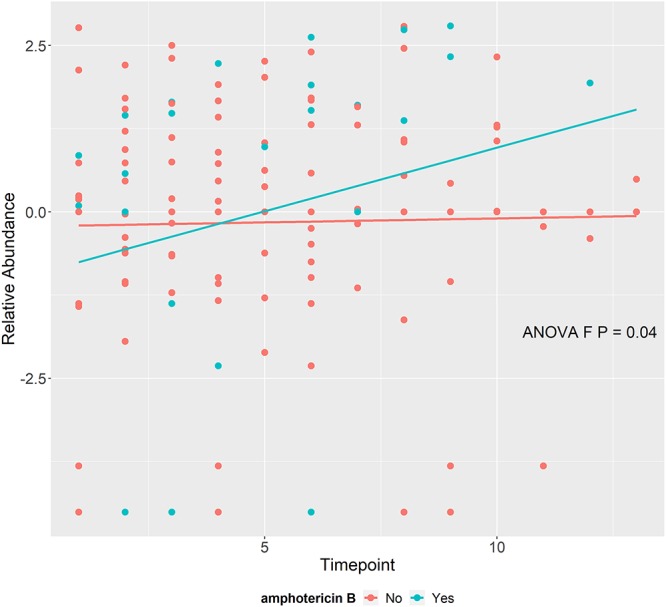
Changes in Fusarium over time stratified by amphotericin B administration. Centered log ratio (clr) data represent transformed relative abundances of Fusarium with fitted lines from the mixed-effects model over time according to whether amphotericin B was administered (aqua) or not (coral) during the study. P values were derived from the ANOVA F-test.