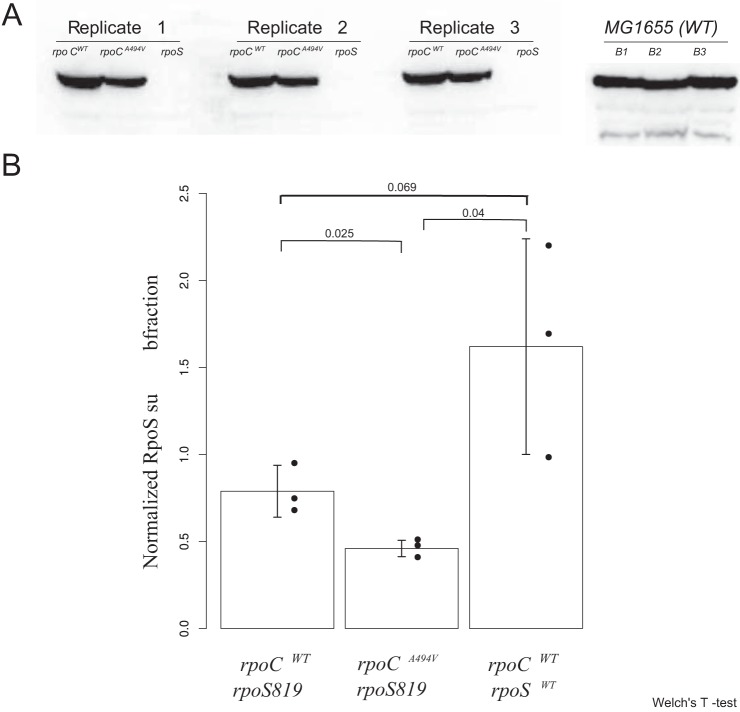
FIG 8.
σS protein level in rpoCWT and rpoCA494V strains in ZK819 background. (A) Nitrocellulose blot containing σS protein in rpoCWT and rpoCA494V strains in the rpoS819 background. The ΔrpoS strain, with the deletion introduced into ZK819, is shown as a control. On the right, σS protein derived from the wild-type MG1655 strain containing the wild-type rpoS allele is shown as positive control. A part of the gel was stained with Coomassie blue, and total protein intensities from each lane were quantified, which were then used for normalizing the RpoS protein intensity (Fig. S3). (B) Normalized intensity of σS protein was quantified for each strain, and average values are shown. Error bars represent standard deviations over three replicates. Statistical significance of difference of intensity between each pair of strains was calculated by Welch’s t test, and P values are shown.

