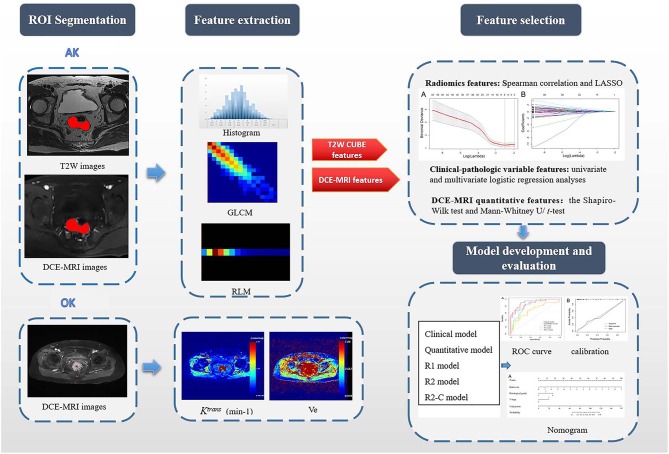
Figure 1.
Flowchart of this study. First, after the VOIs/ROIs of the tumor were manually segmented, 396 features were first extracted each from T2W imaging and DCE imaging. For the measurement of DCE-MRI parameters, a pharmacokinetic analysis was carried out using OK software with the two-compartment extended Tofts model. Second, LASSO analysis was used to reduce the redundancy or selection bias of the features. Then, the Rad-score was calculated for each patient using a linear combination of selected features that were weighted by their respective coefficients. Thereafter, the most significant features for the prediction of EMVI were investigated to construct the radiomics model on the basis of logistic regression; clinical-pathologic risk factors were compared via univariate and multivariate analyses; the quantitative features in DCE-MRI were selected by the Mann–Whitney U/t-test; Finally, different models were constructed and compared. A radiomics nomogram based on the clinical-radiomics model was constructed. Calibration curves and the Hosmer-Lemeshow test were used to graphically investigate the performance characteristics of the radiomics nomogram that were tested in the validation cohort. GLCM, gray-level co-occurrence matrix; RLM, run-length matrix; Ktrans, volume transfer constant between the blood plasma and the extracellular extravascular space; Ve, extracellular extravascular space volume fraction; R1 model, radiomics models based on T2W CUBE; R2 model, radiomics models based on DCE; R2-C model, the combined model based on DCE and clinical-pathological factors.

